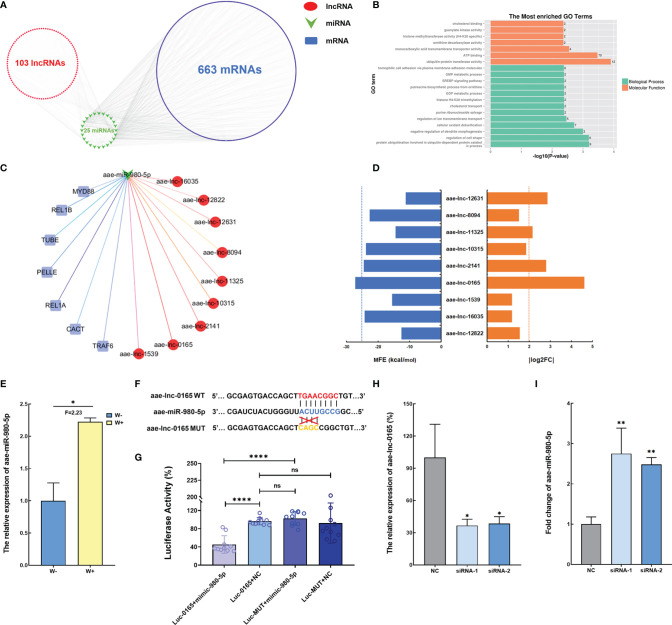
Figure 3.
Wolbachia reduces aae-lnc-0165 to induce aae-miR-980-5p (A) The ceRNA network of DE lncRNA-miRNA-mRNA. (B) GO enrichment analyses of target genes for DE lncRNAs. (C) The ceRNA network based on the Toll pathway regulator genes and DE lncRNAs. Each red circle represents a lncRNA; the green arrow represents miRNAs, while the blue rectangular represents immune genes. (D) The MFE value and absolute value of log2 (fold change) for DE lncRNAs associated with the Toll pathway. The blue dotted line indicates MFE threshold of -25kcal/mol and the orange dotted line indicates that the cutoff value for is 2. (E) The relative expression level of aae-miR-980-5p in W-Aag2 (W+) and Aag2 (W-) cells. (F) Schematic diagram of the target binding sites between aae-miR-980-5p and aae-lnc-0165 predicted by RNAhybrid software. (G) Dual luciferase reporter assay indicates the binding relationship between aae-lnc-0165 and aae-miR-980-5p. Luc-0165+mimic-980-5p represents the 293T cells co-transfected with psi-CHECK-2-WT-0165 and aae-miR-980-5p mimic; Luc-0165+NC indicates the 293T cells co-transfected with psi-CHECK-2-WT-0165 and mimic control; Luc-MUT+mimic-980-5p represents the 293T cells co-transfected with psi-CHECK-2-MUT-0165 and aae-miR-980-5p mimic; Luc-MUT+NC indicates the 293T cells co-transfected with psi-CHECK-2-MUT-0165 and mimic control; n=10. (H) The relative expression of aae-lnc-0165 at 48-hour post transfection. (I) The expression of aae-miR-980-5p at 72-hour post transfection; ****P < 0.0001; **P < 0.01; *P < 0.05; ns means no significant difference. F means fold change.

