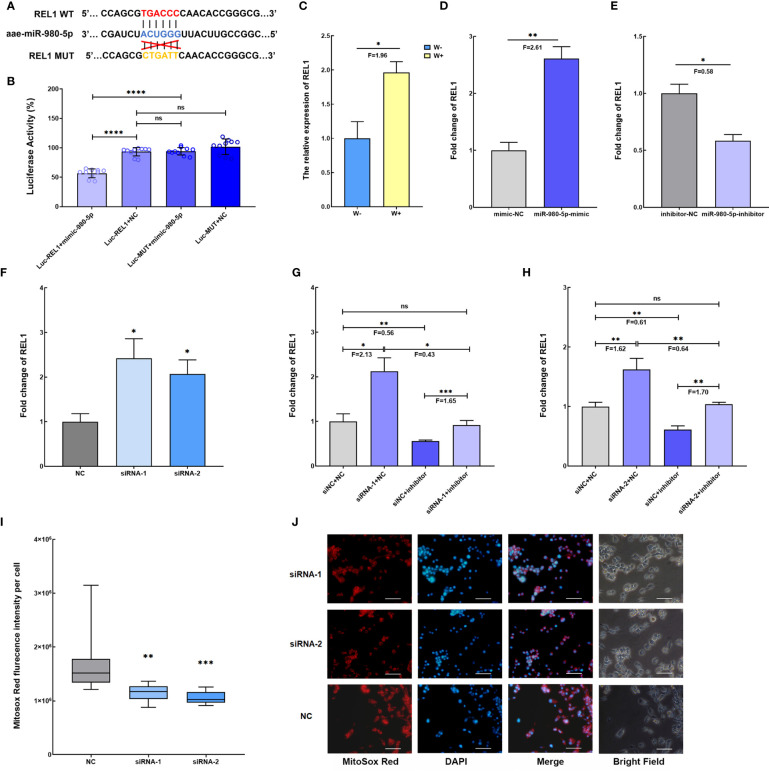
Figure 4.
Wolbachia-induced aae-miR-980-5p via aae-lnc-0165 increases REL1 expression, contributing to the regulation of intracellular ROS stress. (A) Schematic diagram of the predicted target binding sites between aae-miR-980-5p and REL1 by RNAhybrid. (B) Dual luciferase reporter assay confirms the binding sites of aae-miR-980-5p and REL1. Luc-REL1+mimic-980-5p represents the co-transfection of psi-CHECK-2-WT-REL1 and aae-miR-980-5p mimic; Luc-REL1+NC represents the co-transfection of psi-CHECK-2-WT-REL1 and mimic control; Luc-MUT+mimic-980-5p represents the co-transfection of psi-CHECK-2-MUT-REL1 and aae-miR-980-5p mimic; Luc-MUT+NC represents co-transfection of psi-CHECK-2-MUT-REL1 and mimic control. (C) The relative expression level of REL1 in W-Aag2 (W+) and Aag2 (W-) cells. (D) The gain-of-function assay shows that increasing aae-miR-980-5p induces the expression of REL1 at 48 h post-transfection. (E) The loss-of-function assay indicates that silencing of aae-miR-980-5p reduces the expression of REL1 at 48 h post-transfection. (F) The fold change of REL1 expression at 120 h post transfection with siRNA for aae-lnc-0165. Validation of the regulatory relationship for aae-lnc-0165, aae-miR-980-5p, and REL1 via rescue assay using two sequence specific siRNA-1 (G) and siRNA-2 (H) for aae-lnc-0165. siNC+NC represents the cell group treated with siRNA control and inhibitor control; siRNA-1/-2+inhibitor represents the cell group treated with siRNA-1/-2 for aae-lnc-0165 and aae-miR-980-5p inhibitor; siNC + inhibitor represents the cell group treated with siRNA control and aae-miR-980-5p inhibitor; siRNA-1/-2 +NC represents the cell group treated with siRNA-1/-2 and inhibitor control. (I) The fluorescence intensity of mitochondrial ROS per cell at 72 h post transfection using the Mitosox Red probe. The bar represents the range of maximum and minimum value, and the horizontal shows the median. NC represents Aag2 cells transfected with siRNA control. siRNA-1 and siRNA-2 indicates the aae-lnc-0165-depleted W-Aag2 cells by transfection of two distinct siRNAs for aae-lnc-0165. (H) The representative image of siRNA-transfected Aag2 cells at ×40 magnification. The mitochondrial ROS and nucleus were stained with the Mitosox Red probe (red) and DAPI (blue). The white line indicates 50 micrometers; ****P < 0.0001; ***P < 0.001; **P < 0.01; *P < 0.05; ns means no significant difference. F means fold change.

