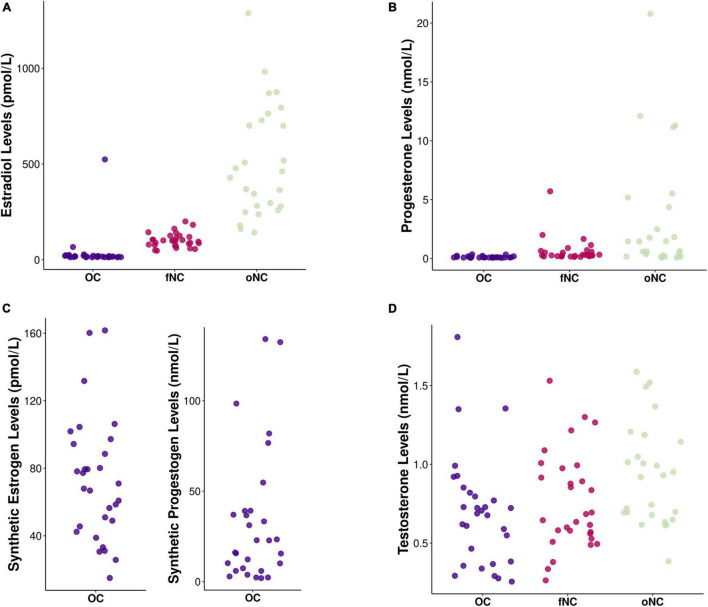
FIGURE 1.
Chart depicting hormone levels of (A) endogenous estradiol (in pmol/L), (B) endogenous progesterone (in nmol/L), (C) exogenous (i.e., synthetic) estrogens (in pmol/L) and progestogens (in nmol/L), and (D) endogenous testosterone (in nmol/L) for each hormonal status group [i.e., OC – oral contraceptive users (blue), fNC – naturally cycling women in early follicular phase (magenta), and oNC – naturally cycling women in periovulatory phase (light green)].

