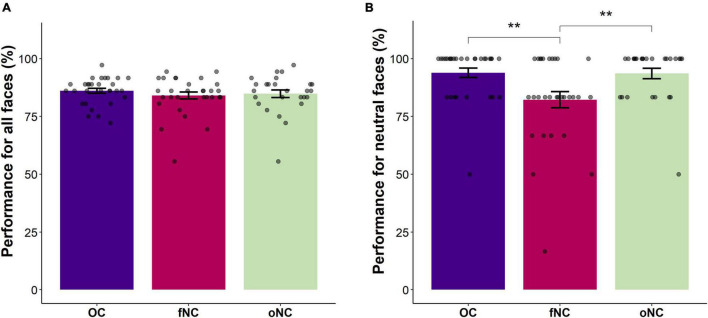
FIGURE 2.
Bar chart depicting the (A) overall emotion recognition accuracy (in percent) and (B) the emotion recognition accuracy for neutral faces (in percent) per group [i.e., OC – oral contraceptive users (blue), fNC – naturally cycling women in early follicular phase (magenta), and oNC – naturally cycling women in periovulatory phase (light green)]. Error bars with 1 SE. **p < 0.01.

