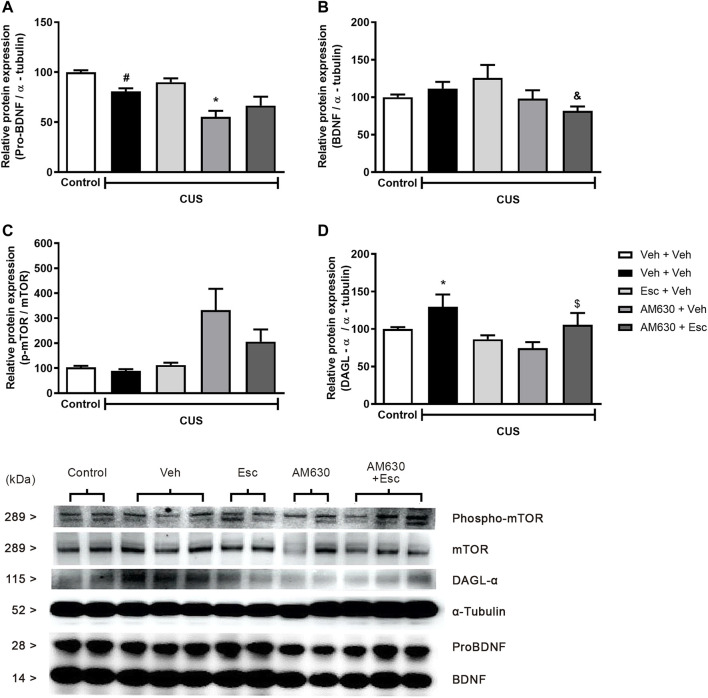
FIGURE 4.
Relative hippocampal protein expression and corticosterone levels of stressed mice treated with ESC in combination or not with AM630. Figure shows the expression of pro-BDNF (A). mature BDNF (B). phospho-mTOR (C) and DAGL (D). Representatives of western blot membranes are detailed in the image. Groups were: non-stressed/saline/saline (n = 5); CUS/saline/saline (n = 5); CUS/AM630/saline (n = 4); CUS/saline/ESC (n = 4); and CUS/AM630/ESC (n = 5). ANOVA-two was employed and differences were considered statistically significant when p < 0,05. N = 4-5/group. (# relative to NS/Veh + Veh; * relative to CUS/Veh + Veh and & relative to the CUS-AM630 compared to CUS-AM630 + Esc).

