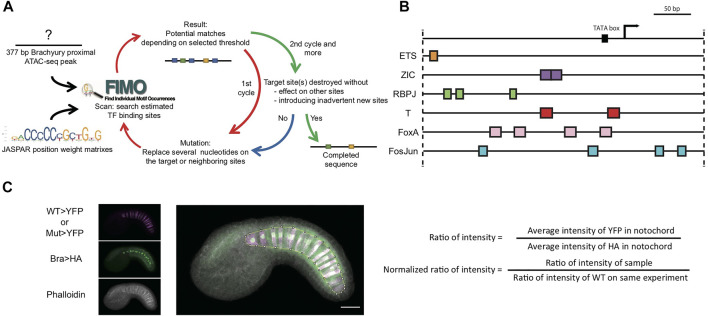
FIGURE 1.
Systematic TFBS mutation and quantitative reporter analysis for the proximal brachyury enhancer. (A) Flowchart for TFBS prediction and mutation design. Black arrows, initial input. Red arrows, procedure for first cycle. Green and Blue arrow, second cycle and decision for completion of mutated sequence. (B) Diagram of predicted TFBSs on bra 377-bp promoter/enhancer. Arrow: endogenous bra transcription start site. The plasmid vector also contains its own bpFOG basal promoter. Colored boxes: predicted TFBSs. (C) Dual reporter image acquisition and analysis strategy. The YFP reporter channel is shown in magenta, and the Bra>H2B:HA internal control channel in green. Phalloidin staining is in greyscale. The overlayed projection is marked with a Region of Interest around the notochord.

