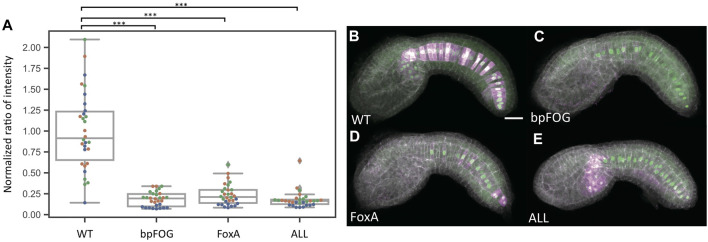
FIGURE 3.
Baseline determination. (A) Normalized reporter expression for an empty vector containing only the bpFOG basal promoter and the two most severe mutant constructs. Each datapoint represents a different imaged embryo. Each color indicates embryos from the same replicate. The box plots indicate the outlier-adjusted minimum, 1st quartile, median, 3rd quartile and outlier-adjusted maximum for each construct. Outliers are marked as lozenges. Asterisks indicate differential reporter expression between the empty or mutant construct and the wildtype construct. ***p < 0.001. (B–E) Representative sum-projected confocal images. (B), wild type. (C), empty construct containing only the bpFOG basal promoter. (D), FoxA. E, ALL. Magenta: YFP reporter expression. Green: Bra>H2B:HA internal control expression. Gray: phalloidin. Scale bar: 20 µm.

