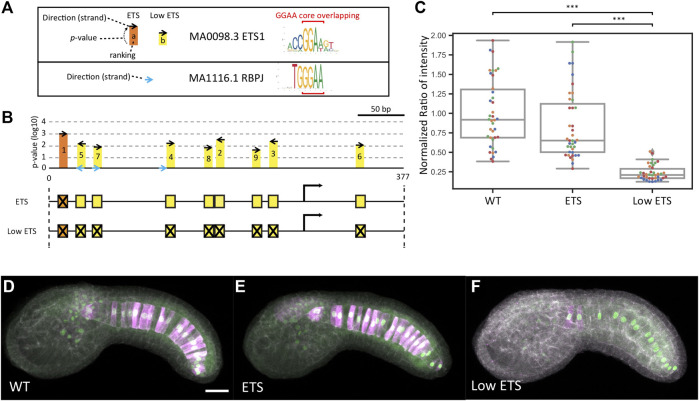
FIGURE 4.
Analysis of low scoring ETS sites. (A) Sequence logos for the ETS and RBPJ Position Weight Matrices used in this study with the overlapping GGAA core indicated with red brackets. On the left is a key for the symbols used in the map in B). (B) Map of the bra proximal promoter/enhancer region showing the high scoring ETS site mutated in the initial ETS construct (orange) and 8 additional lower scoring sites mutated in the Low ETS construct (yellow) Putative RBPJ sites are shown in blue. (C) Normalized reporter expression for the ETS construct versus the Low ETS construct. Each datapoint represents a different imaged embryo. Each color indicates embryos from the same replicate. The box plots indicate the outlier-adjusted minimum, 1st quartile, median, 3rd quartile and outlier-adjusted maximum for each construct. Outliers are marked as lozenges. Asterisks indicate differential reporter expression between the mutant construct and the wildtype construct. ***p < 0.001. (D–F) Representative sum-projected confocal images. (D), wild type. (E), ETS. (F), Low ETS. Magenta: YFP reporter expression. Green: Bra>H2B:HA internal control expression. Gray: phalloidin. Scale bar, 20 µm.

