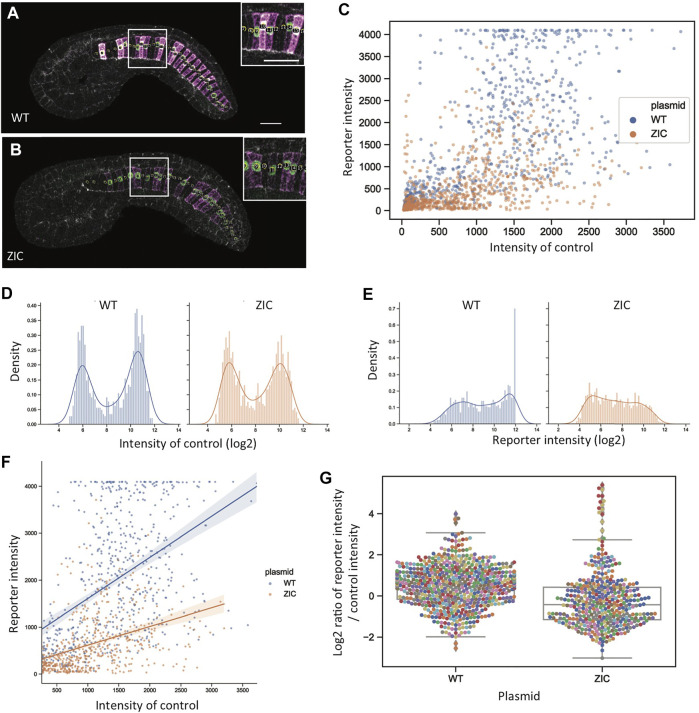
FIGURE 7.
Single-cell reporter quantitation. (A, B) Computationally flattened mid-notochord slices for representative wildtype (A) and ZIC (B) embryos. Insets show zoomed in views with disk-shaped ROIs marked. Magenta: YFP reporter expression. Green: Bra>H2B:H internal control expression. Scale bar, 20 µm. (C) Scatter plot for intensity of reporter (y-axis) and internal control (x-axis). Blue: wildtype. Orange: ZIC. (D,E) Histogram distributions for the log2-transformed intensity of internal control (D) and reporter (E) expression. Blue: wildtype. Orange: ZIC. (F) Scatter plot of reporter and internal control intensity for cells with detectable internal control expression (internal control expression > 256). Linear regression lines show that there is still a relationship between reporter expression and internal control expression for the ZIC construct, but with a decreased slope compared to the wildtype construct. Blue: wildtype. Orange: ZIC. (G) Distributions of the log2-transformed ratio of intensities between reporter expression and internal control expression for the control expressing cells (internal control expression>256).

