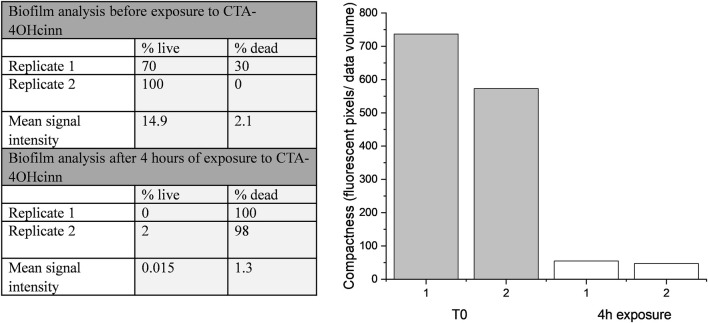
FIGURE 3.
IMARIS (Bitplane) analysis of replicate Nyquist CLSM micrographs as % live cells and % dead cells, and mean signal intensity from green and red channels (left). Fluorescent pixels (pixels that returned a green or red signal) divided by the total volume of data provides an estimation of biofilm compactness (right). This data was constructed from micrograph compactness values before (T0) and after 4 h of exposure to CTA-4OHcinn.

