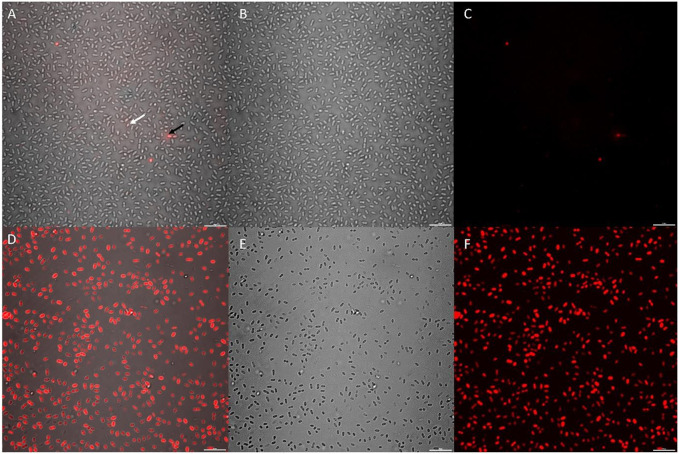
FIGURE 6.
CLSM micrographs depicting K. pneumoniae cells stained with a 10 x concentration of Cellbrite Fix 555; where (A–C) = untreated control sample and (D–F) = CTA-4OHcinn treated sample. (A,D) compare combined channels, (B,E) compare transmission detector channels and (C,F) compare fluorescent signal only. The white arrow indicates a live cell with low Cellbrite Fix 555 signal (membrane fluorescence) and the black arrow indicates a membrane compromised cell emitting greater signal.

