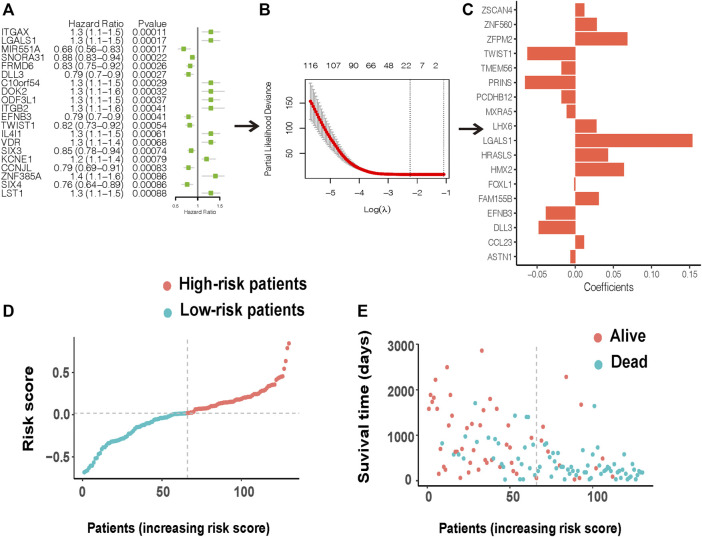
FIGURE 3.
Construction of a prognostic risk model. (A) A forest plot of the top 20 prognosis-related DEGs. (B) LASSO variable screening process. (C) 18 prognostic genes were eventually selected after LASSO regression to establish a prognostic model. (D) Distribution of the risk score for the AML patients. (E) Patients’ status based on the risk score.

