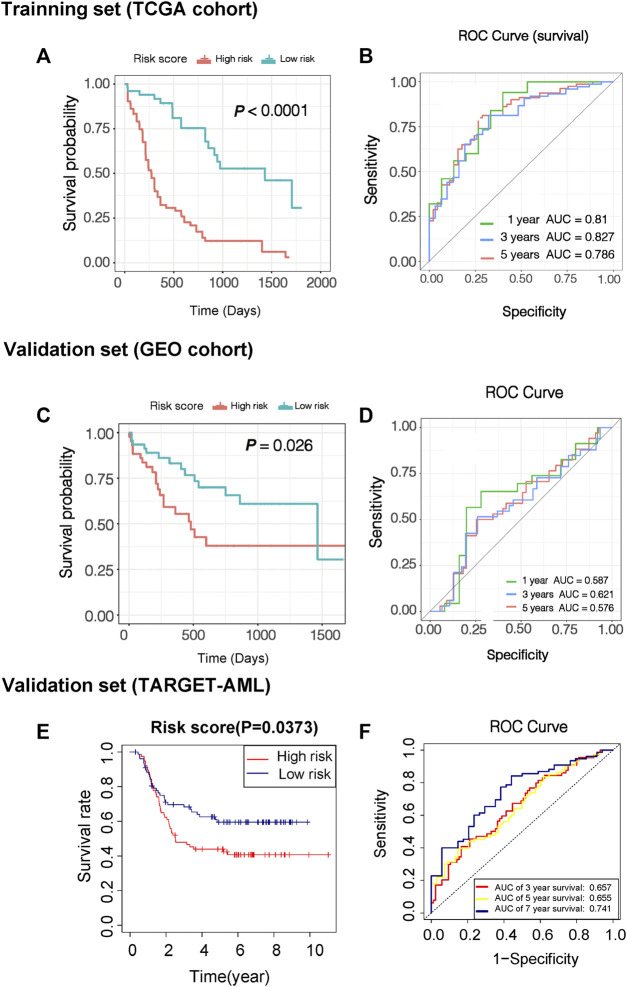
FIGURE 4.
Evaluation of predictive efficacy of prognostic models. (A) KM survival curves of two risk score groups in the training set (TCGA-LAML data sets). (B) ROC curves in the training set (TCGA-LAML data sets), and the 3-year overall survival rates were 0.827. (C) KM survival curves of two risk score groups in the validation set (GSE71014). (D) ROC curves in the validation set (GSE71014) and the 3-year overall survival rates were 0.621. (E) KM survival curves of two risk score groups in the validation set in another validation set (TARGET-AML). (F) ROC curves in another validation set (TARGET-AML) and the 7-year overall survival rates were 0.741.

