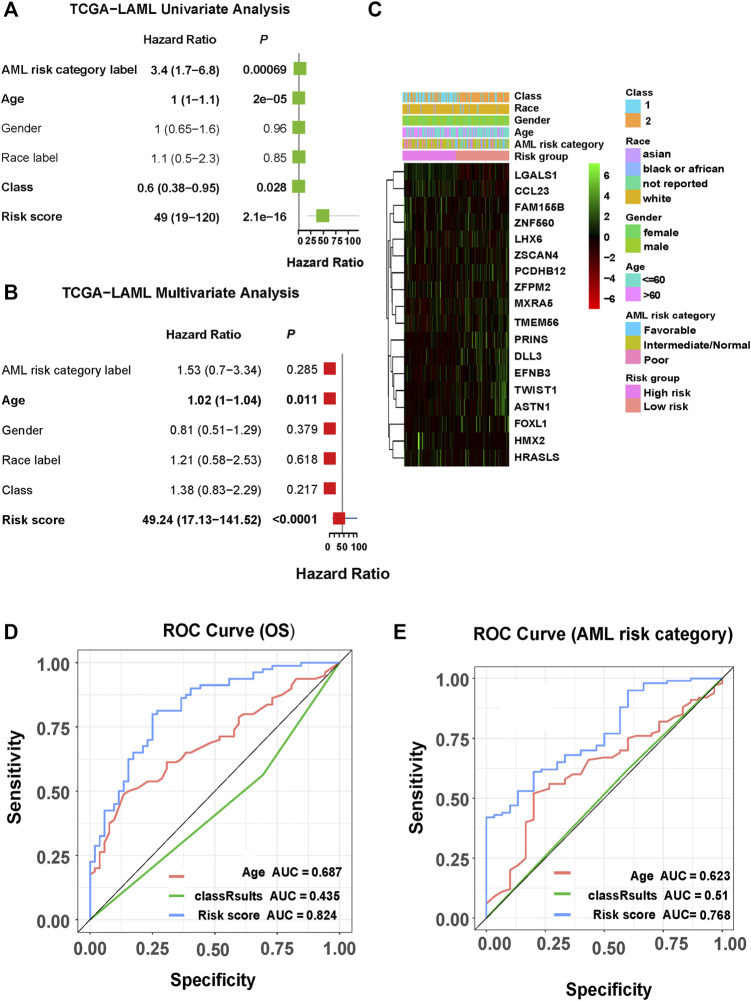
FIGURE 5.
Correlations among clinicopathological characteristics, risk score, and prognostic value in TCGA cohort. (A) Univariate analysis of clinicopathological factors and risk score. (B) Multivariate analysis of clinicopathological factors and risk score. (C) Heat map for the correlations between the 18-gene risk signature and clinicopathological features. (D) ROC curve showing the prediction effect of risk score, age, and class 1/2 on survival rate. (E) ROC curve showing the predictive effects of risk score, age, and class1/2 on AML risk grouping.

