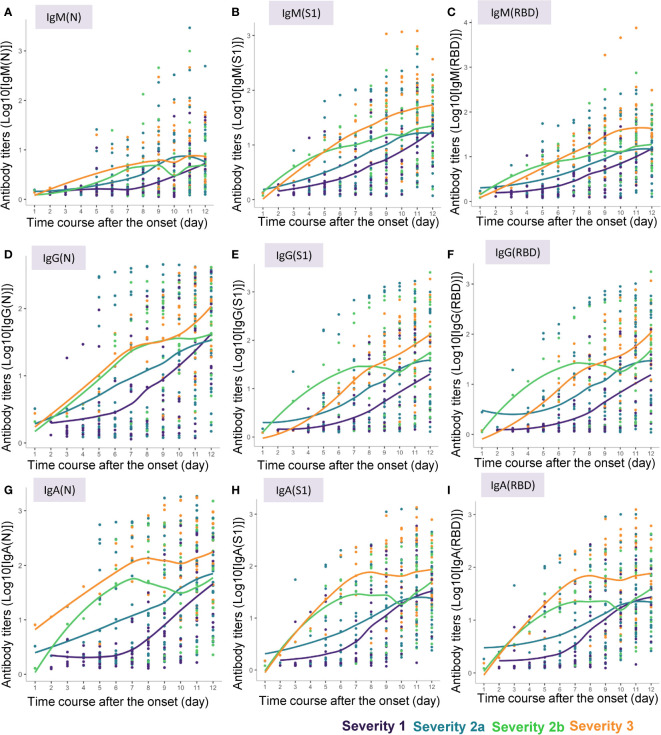
Figure 2.
Approximate curves for the antibody kinetics in COVID-19 patients classified by the disease maximum severity. Local polynomial regression curves were fitted to indicate the antibody responses to the COVID-19 antigens until day 12 after symptom onset in the patients with different maximum severity levels of COVID-19. (A) IgM(N), (B) IgM(S1), (C) IgM(RBD), (D) IgG(N), (E) IgG(S1), (F) IgG(RBD), (G) IgA(N), (H) IgA(S1), (I) IgA(RBD).

