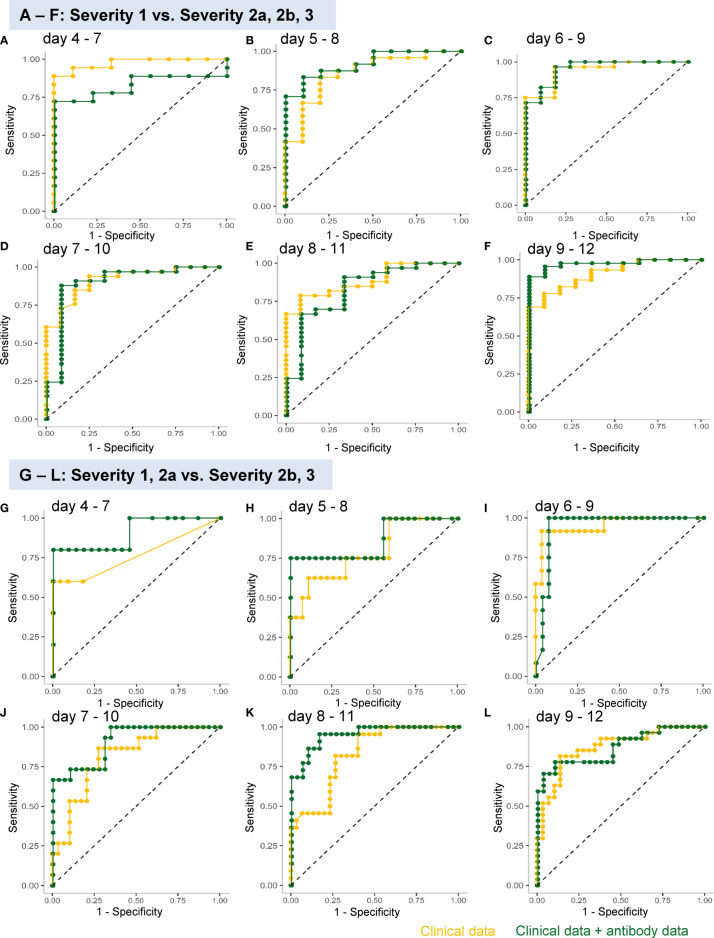
Figure 4.
ROC analyses of the analysis models constructed using a machine learning technique for predicting the maximum severity of COVID-19. The ROCs of the analysis models constructed using a machine learning technique for predicting the COVID-19 severity, using the data obtained on day 4–7 (A, G), day 5–8 (B, H), day 6–9 (C, I), day 7–10 (D, J), day 8–11 (E, K), and day 9–12 (F, L), are shown. The models were constructed to distinguish severity groups 2a or over from severity group 1 (A–F) or distinguish severity groups 2b and 3 from severity groups 1 and 2a (G–L). The yellow curves represent the ROCs of the model constructed using clinical parameters and the green curves represent those of the model constructed using both clinical and antibody data.

