
Figure 1. Trajectories of blood pressure over the menopause transition (n=3302).
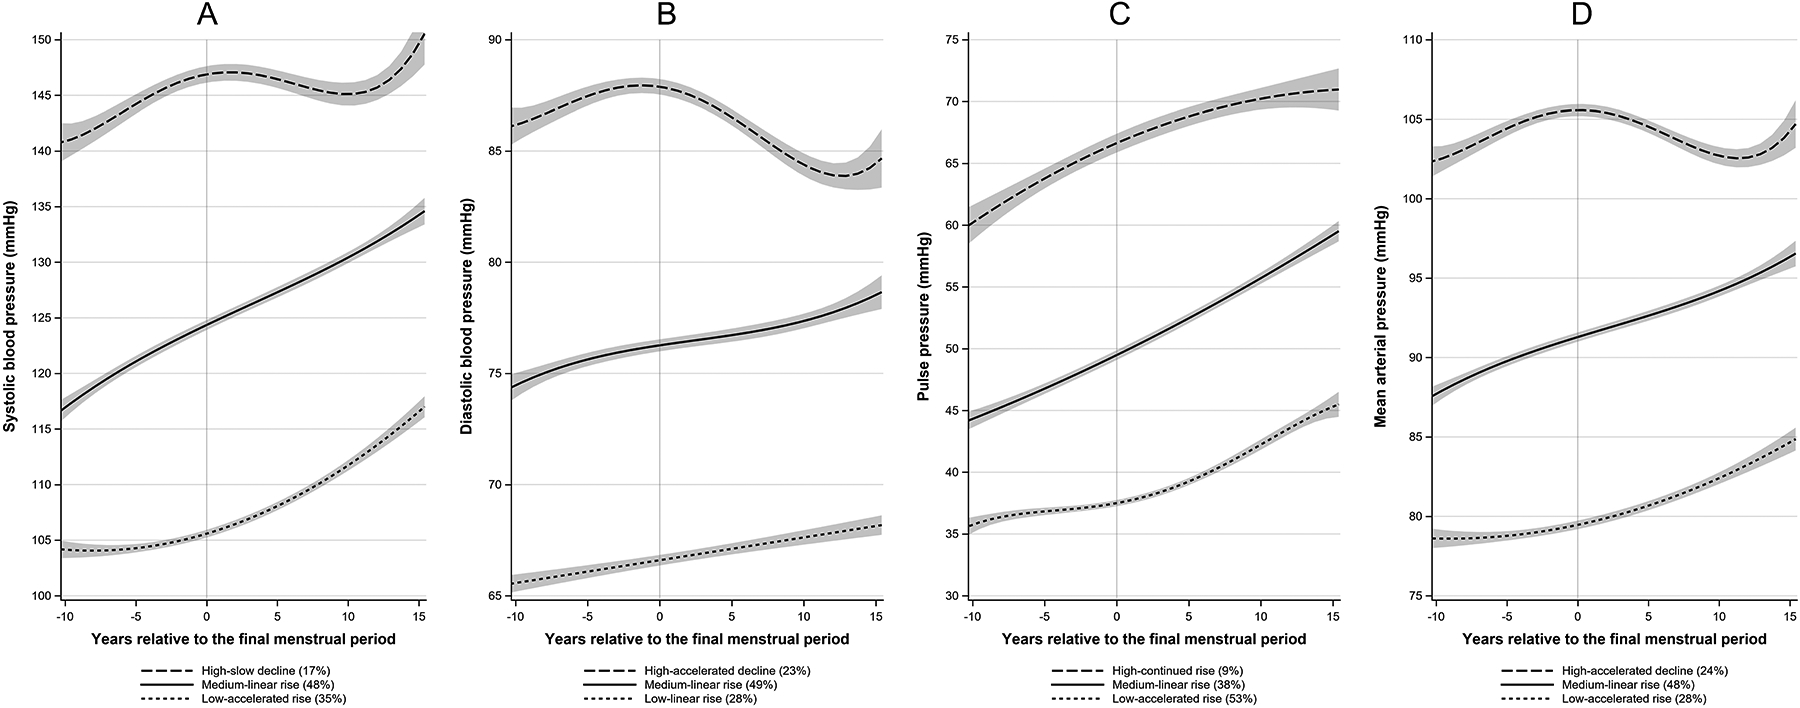
Blood pressure represents the predicted mean at each time point within each trajectory group from group-based trajectory modelling. No factors were included in the model. Bands represent 95% CI. Panel A: systolic blood pressure; Panel B: diastolic blood pressure; Panel C: pulse pressure; Panel D: mean arterial pressure.