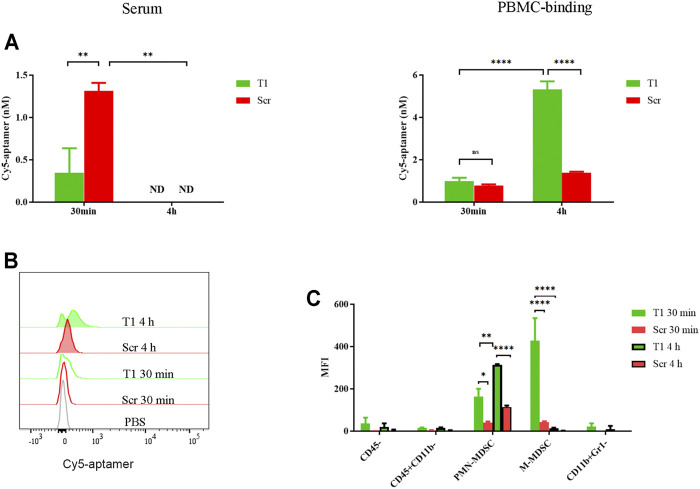
FIGURE 1.
Partition of aptamer in circulation. 4T1 tumor-bearing mice were treated i.v. with 0.4 nmol Cy5-T1 thioaptamer (T1) or Cy5-scramble aptamer (Scr), and periphery blood samples were collected 30 min and 4 h later for fluorescent analysis. (A) Fluorescent intensity in serum and PBMCs. ND: not detectable. (B) Flow cytometry analysis of cell-associated Cy5-aptamers at the 30 min and 4 h time points. (C) Distribution of Cy5-aptamer among cell subsets in PBMC. MFI: median fluorescence intensity.

