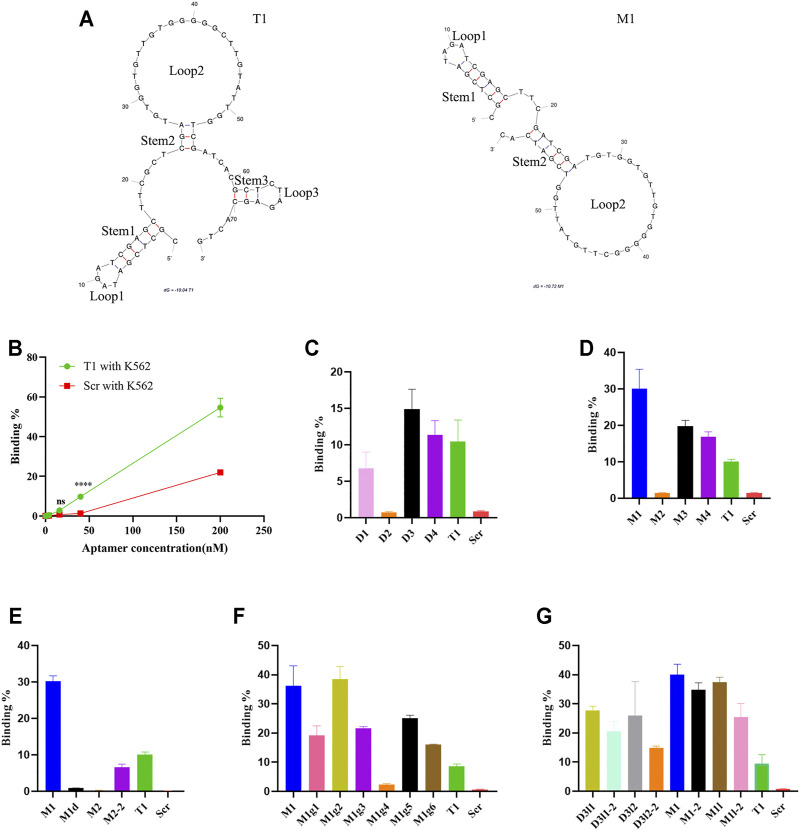
FIGURE 2.
Analysis of aptamer binding to K562 cells. (A) Predicted secondary structures of T1 and M1 aptamers. Stems and loops in the aptamer are labeled. (B) Dose-dependent binding of aptamers to K562 cells based on flow cytometry analysis. (C–G) Flow cytometry analysis on binding of K562 cells by T1 and derived aptamers.

