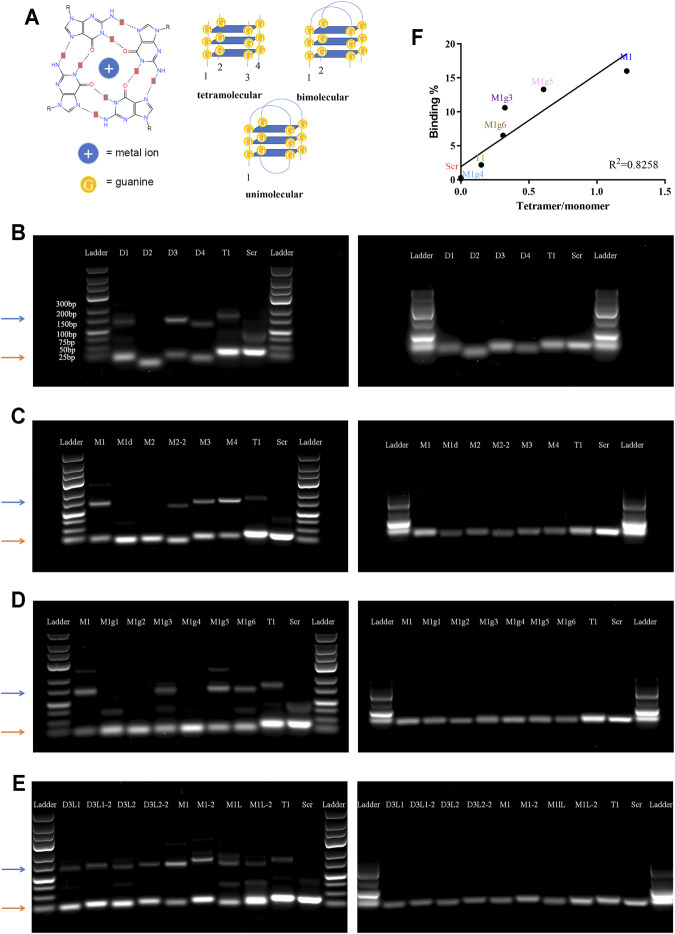
FIGURE 3.
Analysis of tetramolecular G-quadruplex. (A) Schematic view of special secondary structures of G-quadruplex. Left panel: molecular structure of a G-quartets. Right panels: Secondary structures of unimolecular, bimolecular, and tetramolecular G-quadruplexes. (B–E) Images of agarose gel electrophoresis results. Left panels: non-denatured gels; right panels: denatured gels. Orange arrows point to the monomer bands, and blue arrows point to the tetramer bands. (F) Correlation between cell binding affinity and tetramer/monomer ratio.

