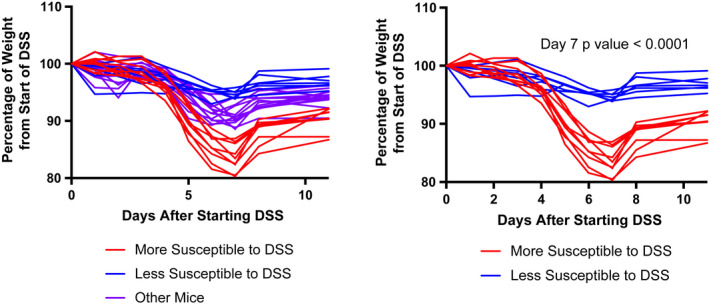
FIGURE 1.

Discovery cohort weights. Weight graphs of all mice in discovery cohort (left graph) and comparison of mice we arbitrarily identified as most (n = 9)/least (n = 7) susceptible to DSS after experiment (right graph). The p value between these two groups at day 7 was <0.0001 [Colour figure can be viewed at wileyonlinelibrary.com]
