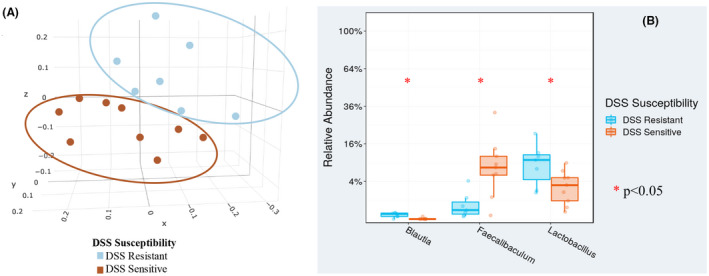
FIGURE 2.

Principal coordinate analysis (PCoA) indicated microbiome separation and increased abundance of Lactobacillus pre‐DSS. (A) Weighted PCoA indicated that there was a distinct microbial separation (p = 0.001) between the mice that lost the most weight (DSS‐sensitive: DSS‐S) and the mice that lost the least weight (DSS‐resistant: DSS‐R) after start of DSS. (B) Blautia, Faecalibaculum, and Lactobacillus separated most at pre‐DSS between the DSS resistant and DSS sensitive microbiomes (Blautia: p = 0.003; Faecalibaculum: p = 0.01; Lactobacillus: DSS‐S mean = 3.53%, DSS‐R mean = 9.32%, p = 0.04) [Colour figure can be viewed at wileyonlinelibrary.com]
