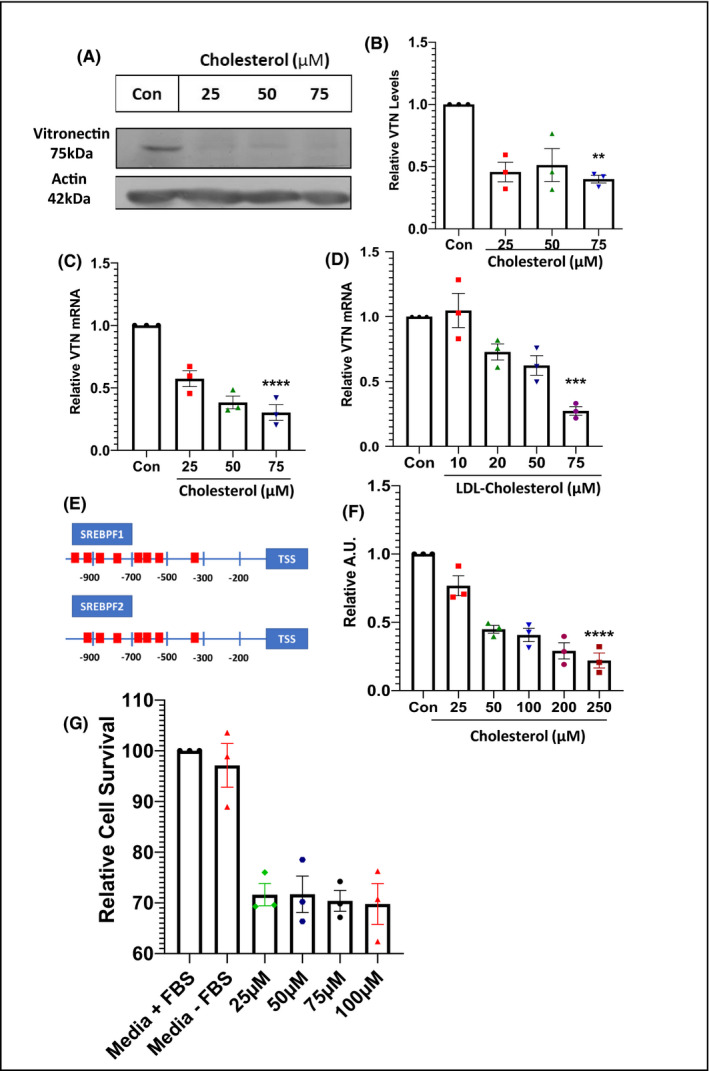
FIGURE 2.

Cholesterol regulates vitronectin expression (A) Western blot of vitronectin (VTN) from HepG2 cells treated with increasing concentration of cholesterol (25, 50, 75 µM) for 48 h with replenishment at 24 h, and its relative quantification (B, n = 3). (C) Expression levels of VTN under similar conditions. (D) Expression level of VTN in HepG2 cells in presence of increasing concentration of LDL‐C for 48 h (n = 3). (E) Schematic representation of binding sites for SREBPF1 and SREBPF2 in the promoter region of human VTN gene. (F) Luciferase assay showing human VTN promoter activity in response to increasing concentration of cholesterol for 48 h in HEK293T cells (n = 3), one‐way ANOVA, with Bonferroni post hoc test. (G) MTT‐assay of HepG2 cells showing relative cell survival of cells at different concentrations of cholesterol, n = 3 *p < 0.05, **p < 0.01, ***p < 0.001, ****p < 0.0001
