FIGURE 4.

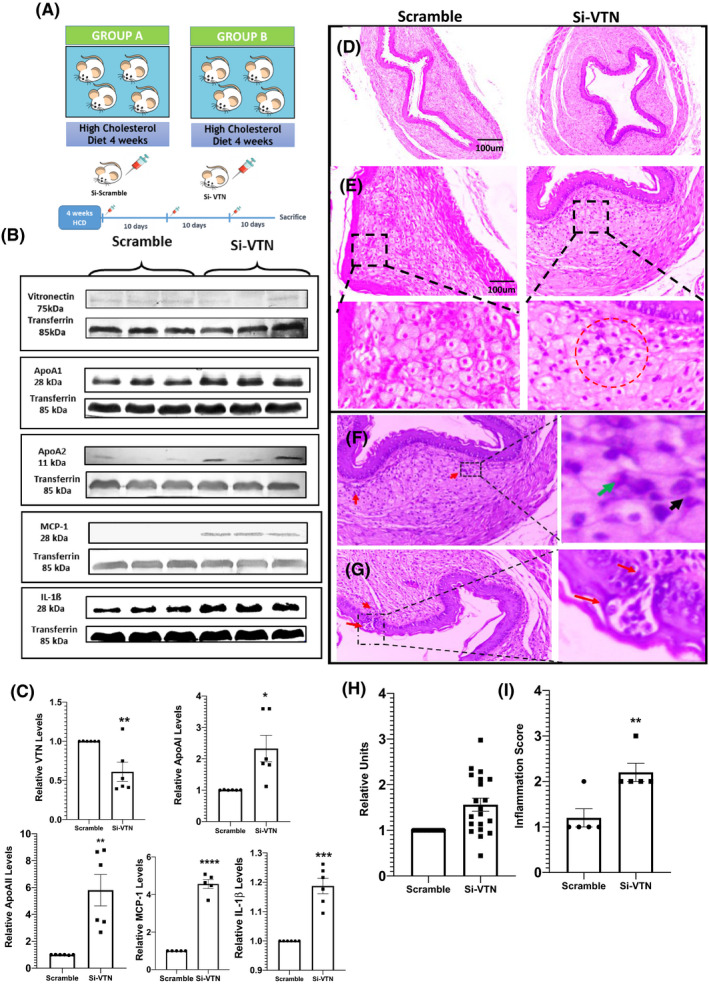
Increase in plaque size and migration of inflammatory cells in atherosclerotic plaque in vitronectin (VTN)‐deficient ApoE−/− mice (A) Schematic diagram showing the experimental design of VTN silencing by si‐RNA. (B) Western blot showing plasma level of VTN, ApoA‐I, ApoA‐II, MCP‐1 and IL‐1β in scramble and VTN siRNA treated ApoE−/− mice (n = 6) and their respective relative quantification (C). Representative image of hematoxylin and eosin stained sections of aorta from both groups (D). Clustering of inflammatory cells near the intima region in the plaque of VTN siRNA treated mice (E). Scale bar = 100 µm. Aortic sections from VTN siRNA treated ApoE−/− mice showing inflammatory cells (F) and recruitment of inflammatory cells from tunica media to tunica intima (G) Inset (H) shows magnified image in which ‐migration of inflammatory cells are visible. Inset (G) shows magnified image in which microvessle formation can be observed. (H) Histogram showing intima‐media thickness of aorta in both groups. (I) Graph showing the inflammation score in two groups, unpaired t‐test. *p < 0.05, **p < 0.01
