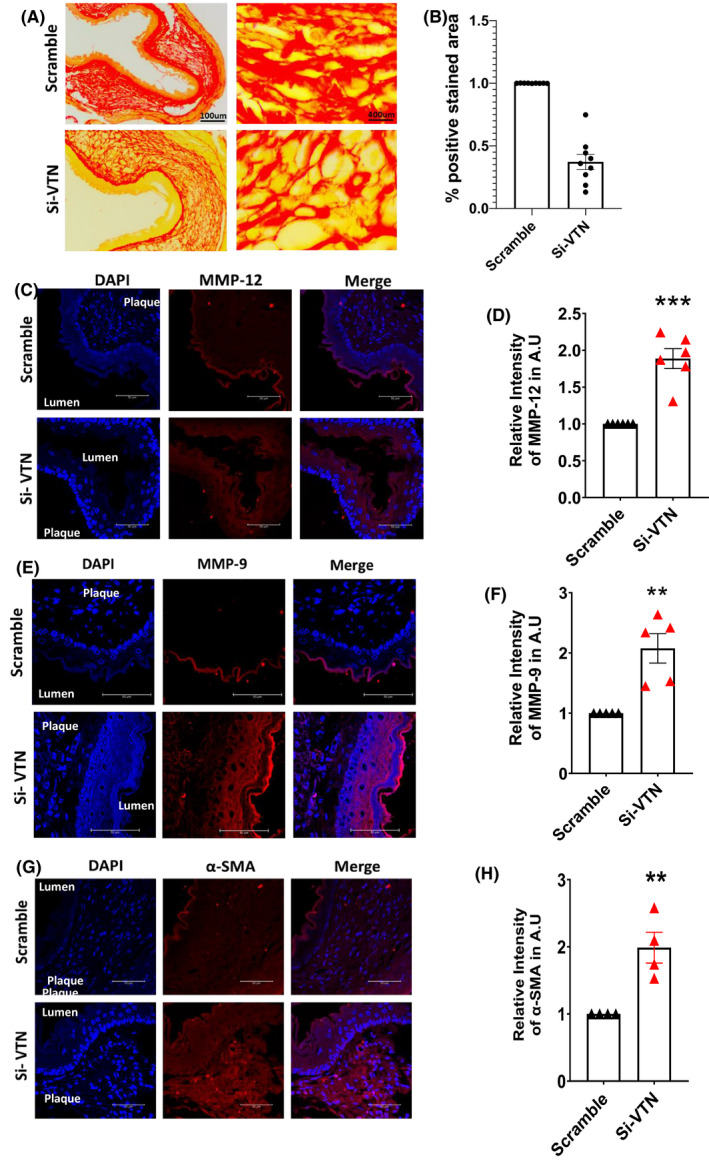
FIGURE 6.

Effect of VTN downregulation in arterial remodeling (A) Picrosirius red staining of mice aorta in scramble and VTN‐siRNA treated mice (n = 6). (B) Graph showing the 0.36‐fold decrease in collagen content in VTN downregulated aorta. Scale bar = 100, 400 µm. Immunofluorescent staining of mice aorta showing an increase in the expression of MMP‐12 (C), MMP‐9 (E) and and α‐SMA (G) in both groups. Representative and the quantitative data (mean ± SEM) of relative mean fluorescence intensity from mice are presented here (D, F, H n = 4–5). Scale bar = 50 µm, unpaired t‐test. MMPs, matrix metalloproteases; VTN, vitronectin. *p < 0.05, **p < 0.01, ***p < 0.001
