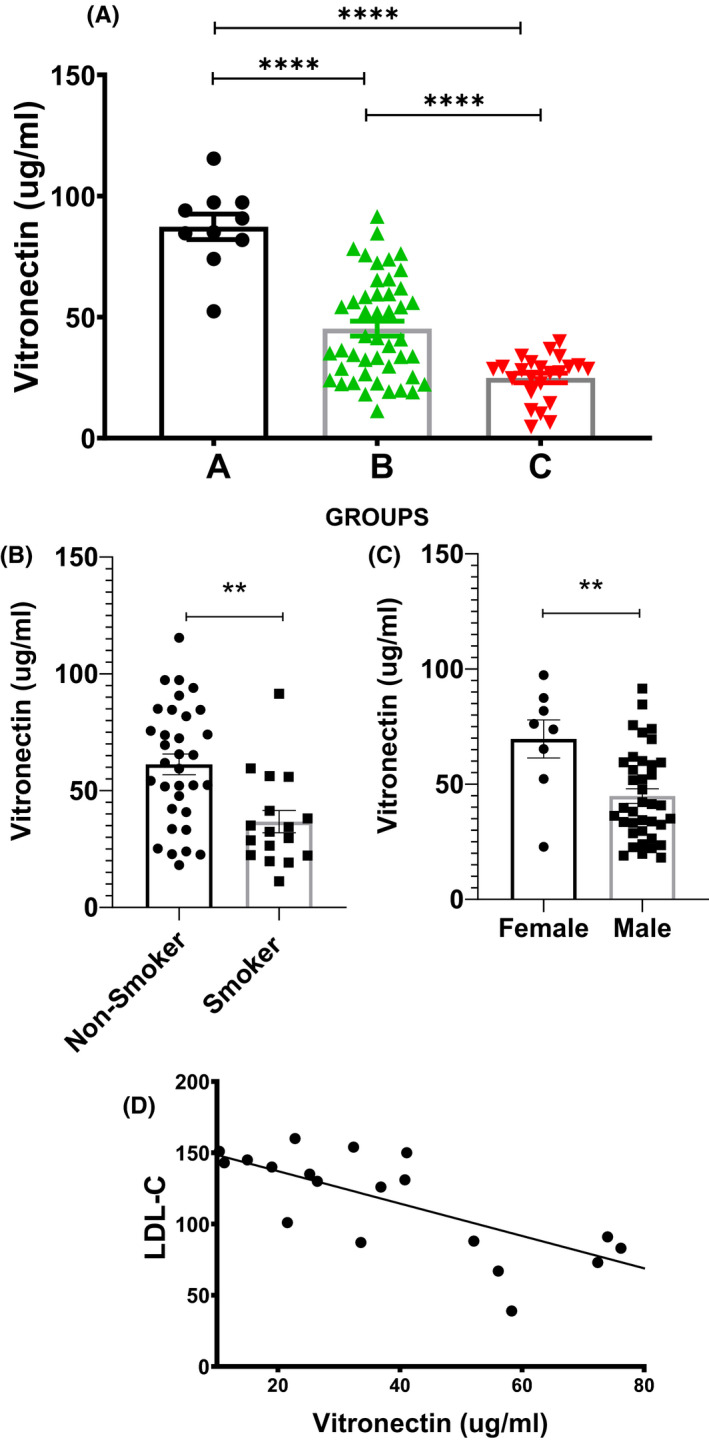
FIGURE 7.

Estimation of plasma level of vitronectin (VTN) in human subjects and its correlation with risk factors associated to coronary artery disease (CAD). (A) Illustrative dot plot showing levels of VTN in plasma of Group A (Healthy control, n = 10), Group B (Control with risk factors, n = 46) and Group C (acute coronary syndrome patients, n = 23). (B) Scatter Plot showing the plasma levels of VTN in non‐smoker (n = 30) versus smokers (n = 16). (C) Scatter Plot showing the plasma levels of VTN in female (n = 8) and male (n = 38) subjects. (D) Scatter plot showing the correlation between VTN levels and low‐density lipoprotein‐cholesterol (LDL‐C) in human aged above 40 years (Pearson correlation coefficient = −0.74, n = 19), unpaired t‐test. **p < 0.01, ****p < 0.001
