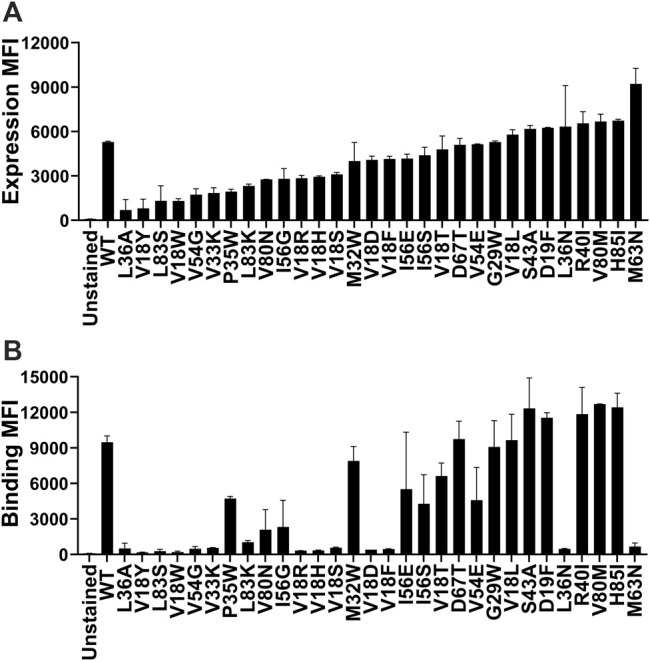
FIGURE 1.

Comparison of the level of expression and binding of CcdB mutants on the yeast cell surface. (A) The expression and (B) binding to GyrA14 of individual mutants. Errors are calculated from two biological replicates. Most mutants expressed at high levels, however, the amount of active protein varied widely. A few mutants which showed a high level of expression did not show any binding to GyrA14. In both panels, mutants are arranged in order of increasing expression level.
