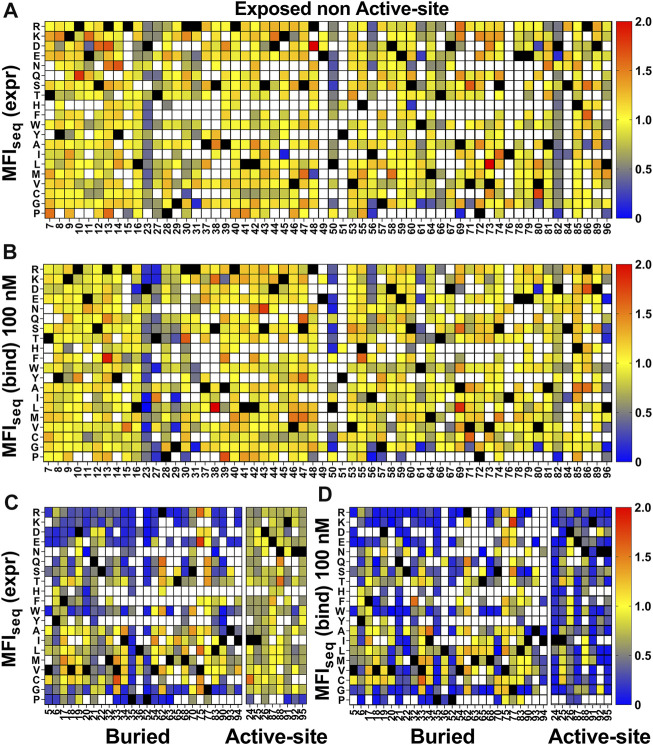
FIGURE 3.
Heatmap of normalized MFIseq values for CcdB mutants. MFIseq value of mutant was divided by the MFIseq value of WT to normalize it. (A) MFIseq (expr) and (B) MFIseq (bind) at 100 nM GyrA14 for exposed non active-site residues. (C) MFIseq (expr) and (D) MFIseq (bind) for buried and active-site residues. Exposed, buried (PDB ID:3VUB) and active-site (PDB ID:1X75) residues are segregated based on the crystal structure. Residues which had accessibility greater than 10% were considered exposed, all remaining residues were considered buried, and active-site mutants in contact with GyrA14 were identified as explained the Methods section. Blue to red colour represents increasing normalized MFIseq values, black colour shows the WT residue at the corresponding position. White colour indicates that the mutant is not available. The buried site residues have very high mutational sensitivity both in case of expression and binding. The active-site residues show mutational sensitivity only with respect to Gyrase binding. Information about the mutational sensitivity of expression and binding can be used to differentiate exposed, buried and active-site residues.

