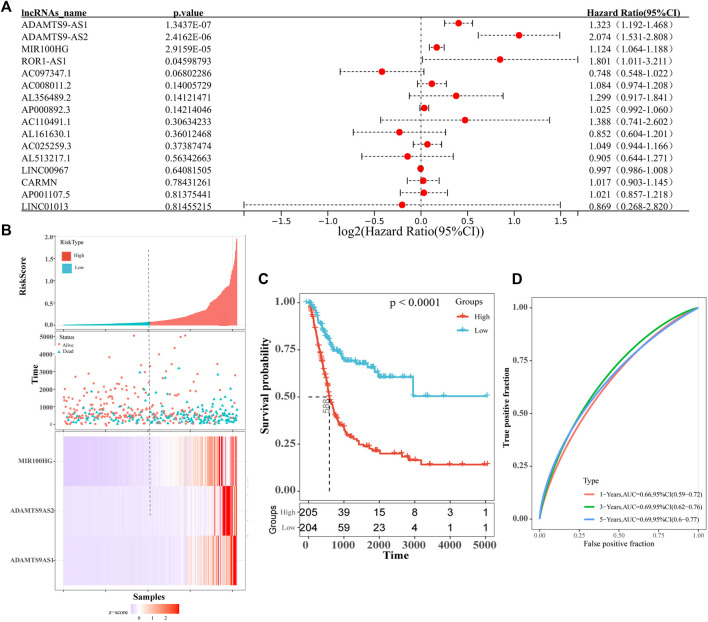
FIGURE 3.
(A) Forest map shows univariate COX analysis results of lncRNAs associated with prognosis of bladder cancer patients. The red dots represent the Hazard ratio of univariate Cox regression analysis, and the two ends of the red dot represent the maximum and minimum values of the 95% confidence interval(95%Cl). (B) The distribution of risk scores (picture above), patient relapse status (picture middle) and gene expression levels (picture above) of 3-lncRNA signature (ADAMTS9-AS1, ADAMTS9-AS2 and MIR100HG). The black dotted line represents the median risk score cut-off dividing patients into low- and high-risk groups. (C) Kaplan–Meier plot of overall survival for patients in low-risk and high-risk groups. The black dotted line represents median survival time. The table at the bottom is the risk table, which counts the sample size for each risk group. Significant prognostic differences(p-value) between the two groups were assessed by logrank test(p-value<0.0001). (D) ROC curve for the 1 year (red curve), 3 years (green curve) and 5 years (blue curve) survival prediction by the 3-lncRNA signature (ADAMTS9-AS1, ADAMTS9-AS2 and MIR100HG).

