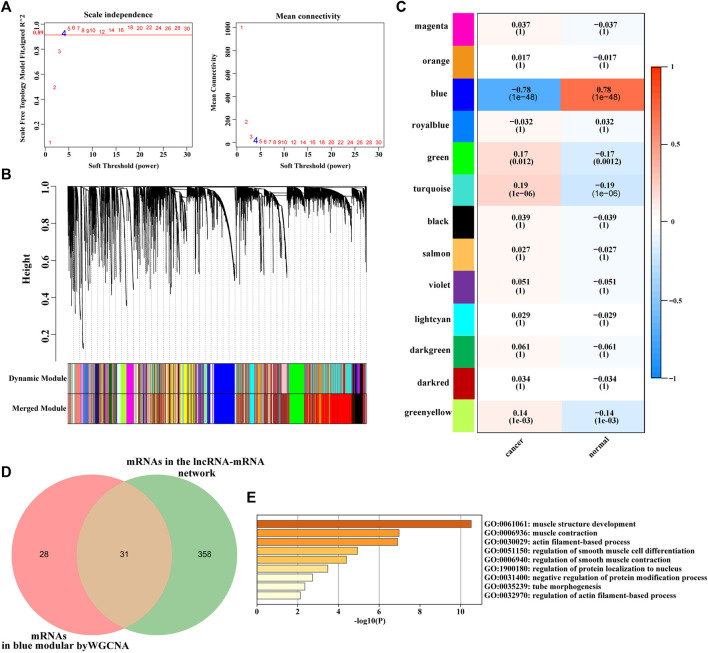
FIGURE 5.
(A) (left): Analysis of the scale-free fit index for various soft-thresholding powers. (A)(right): Analysis of the mean connectivity for various soft-thresholding powers. The red line represented the square of the correlation coefficient, 0.89, and the first point above red line was the soft threshold β = 4. (B) Hierarchical cluster analysis of mRNAs (the median absolute deviation (MAD)>50%) was conducted to detect co-expression clusters with corresponding color assignments. Each color represents a module in the constructed gene co-expression network by WGCNA. (C) Heat map of the correlation between modules and traits. The box includes the Pearson correlation coefficient (PCC) and the corresponding p-value. The box color (ranges from blue to red) is correlated with the PCC value (range from –1 to 1). The red box indicates the module is positively correlated with traits, while the blue box indicates the module is negatively correlated with traits. The traits in this study were bladder cancer status (cancer and normal). (D) Venn diagram of differentially expressed mRNAs in lncRNA-mRNA coexpression network and mRNAs screened via WGCNA in TCGA bladder cancer dataset. (E) The Bar graph shows the enriched terms of 31 mRNAs using Metascape(http://metascape.org/), colored by p-values. Adj.p-value <0.05 were considered statistically significant. The darker the color, the greater the p-value.

