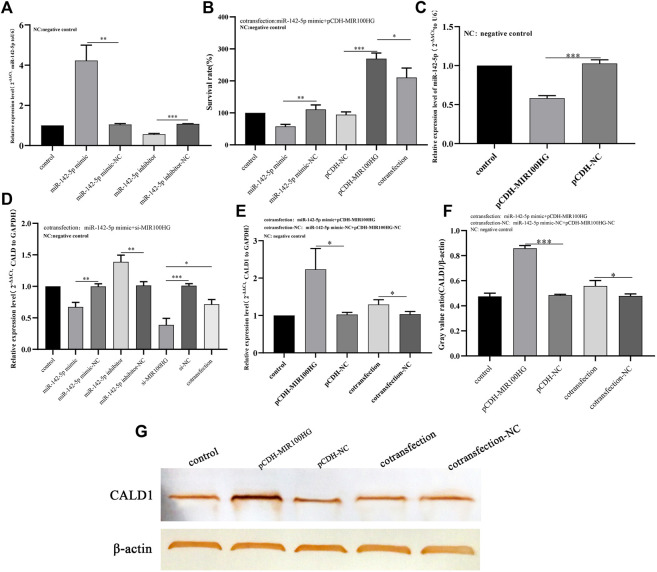
FIGURE 9.
(A) Analysis of the effects of miR-142-5p knockdown or overexpression in 5,637 cells using qPCR. The expression level of U6 was used as an internal reference. (B) The effect of miR-142-5p interference with MIR100HG on the proliferation of 5,637 cells using CCK8 assay. (C) Analysis of effect of MIR100HG overexpression on endogenous miR-142-5p expression in 5,637 cells using qPCR. The expression level of U6 was used as an internal reference. (D) Analysis of effect of miR-142-5p interference with MIR100HG on CALD1 expression in 5,637 cells using qPCR. The expression level of GAPDH was used as an internal reference. (E) Analysis of effect of miR-142-5p targeted by MIR100HG on CALD1 expression level in 5,637 cells using qPCR. The expression level of GAPDH was used as an internal reference. (F,G) Analysis of effect of miR-142-5p targeted by MIR100HG on CALD1 protein level in 5,637 cells using western blot. The protein level of β-actin was used as an internal reference. NC stands for negative control. pCDH-NC represents negative plasmid of pCDH- vector, and has no effect on cell biological function after transfection. Si-NC represents the negative control of si-RNA, which has no effect on cell biological function after transfection. “Control” refers to the cell group without any plasmid transfection, which is only used as a reference for the analysis of the experimental group. The data are shown as the mean ± standard deviation. Cotransfection: The two target plasmids were transferred into cells at the same time. Cotransfection-NC: The negative control of the two target plasmids were transferred into the cells at the same time. “***” p-value <0.001,”**” p-value <0.01,”*” p-value <0.05.

