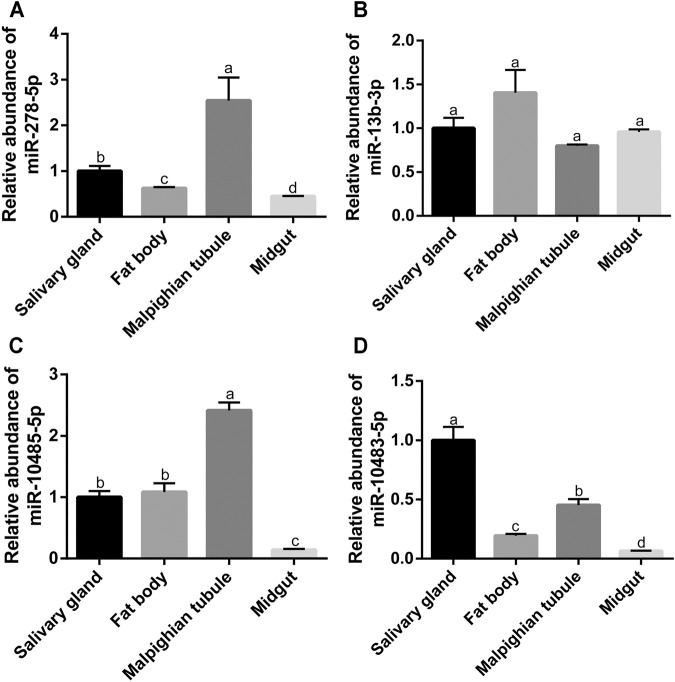
FIGURE 7.
Expression of four miRNAs in different tissues of S. frugiperda. (A–D) Analysis of the miR-278-5p expression at the different tissues of the salivary gland, fat body, Malpighian tubule, and midgut. The letters a, b, c, d, e, and f represent significant differences (p < 0.05). Results are shown as the average±standard error (SE).

