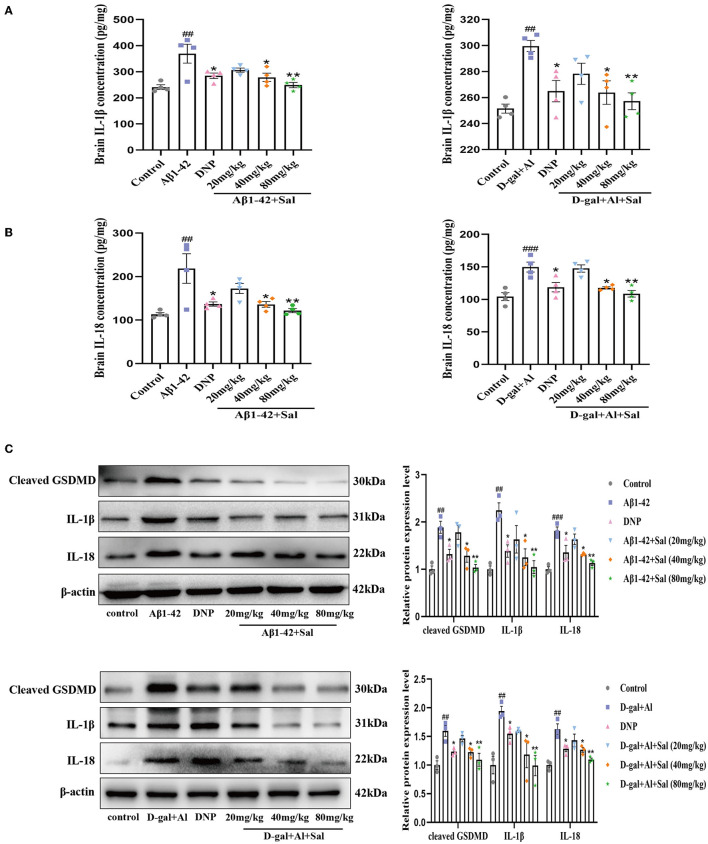
Figure 6.
Sal mitigated pyroptosis in Aβ1-42 and D-gal/AlCl3-induced AD mice. Aβ1-42 and D-gal/AlCl3-induced AD mice brain expression of IL-1β (A) and IL-18 (B) analyzed by enzyme-linked immunosorbent assay (ELISA) kits (n = 4). (C) The Western blot analysis of IL-1β, IL-18, and cleaved GSDMD in the hippocampus of the AD mice (n = 3). Image J was applied to quantify the bands, and a histogram represents the differences after normalization to β-actin. All data are represented as mean ± SEM. ##P < 0.01, ###P < 0.001 vs. control group, *P < 0.05, **P < 0.01, vs. Aβ1-42 and D-gal/AlCl3 group.

