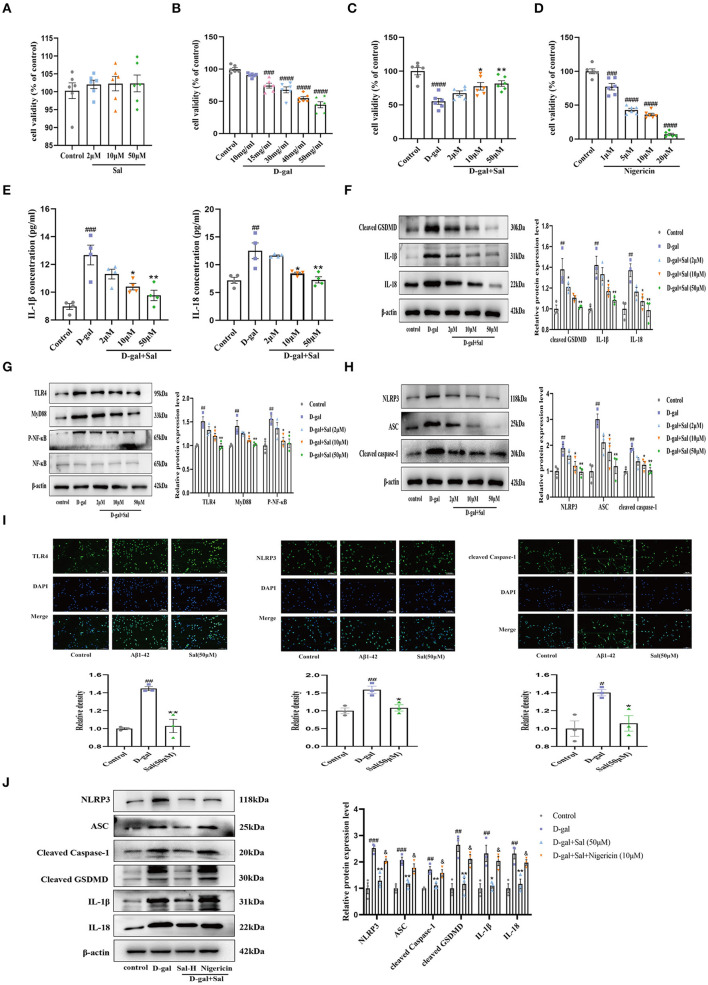
Figure 9.
Sal regulated PC-12 cell pyroptosis via inhibiting the TLR4/NF-κB/NLRP3/ASC/Caspase-1 signaling pathways. (A) CCK-8 measured the cytotoxic effects of Sal on PC12 cells; Sal treatment has no significant cytotoxicity on PC12 cells (n = 6). (B,C,E) CCK-8 conducted the assays on PC12 cells viability after the cells were pre-treated with Sal for 2 h, and then added D-gal for 48 h. (B) PC12 cells Viability was decreased as the increased concentration of D-gal (n = 6). (C) Sal treatment dose-dependently prevented PC12 cells from damage (n = 6). (D) With the increase of Nigericin concentration, the viability of PC12 cells decreased gradually (n = 6). (E) IL-1β and IL-18 levels in the cell supernatant by ELISA (n = 4). (F) The Western blot analysis of cleaved GSDMD, IL-1β, and IL-18 of PC12 cells (n = 3). (G) Immunoblots of TLR4, MyD88, NF-κB and, p-NF-κB. p-NF-κB was normalized with NF-κB and others were normalized with β-actin. (H) The expression of NLRP3, ASC, and cleaved Caspase-1 of PC12 cells was detected by western blotting (n = 3). (I) PC12 cells were pre-treated with Sal for 2 h, following added D-gal for 6 h. Then immunofluorescence staining using specific antibody TLR4, NLRP3, and cleaved Caspase-1 (green) immunofluorescence. Scale bar, 50 μm, the magnification of merge is 200 × (n = 3). (J) Western blot was used to examine the expressions of NLRP3, ASC, cleaved Caspase-1, cleaved GSDMD, IL-1β, and IL-18 in the different groups (n = 3). Image J was used to quantify the bands, and a histogram represents the differences after normalization to β-actin. All the results are shown as means ± SEM. #P < 0.05, ##P < 0.01, ###P < 0.001, ####P < 0.0001 vs. control group, *P < 0.05, **P < 0.01 vs. D-gal group. &P < 0.05 vs. Sal-H group.

