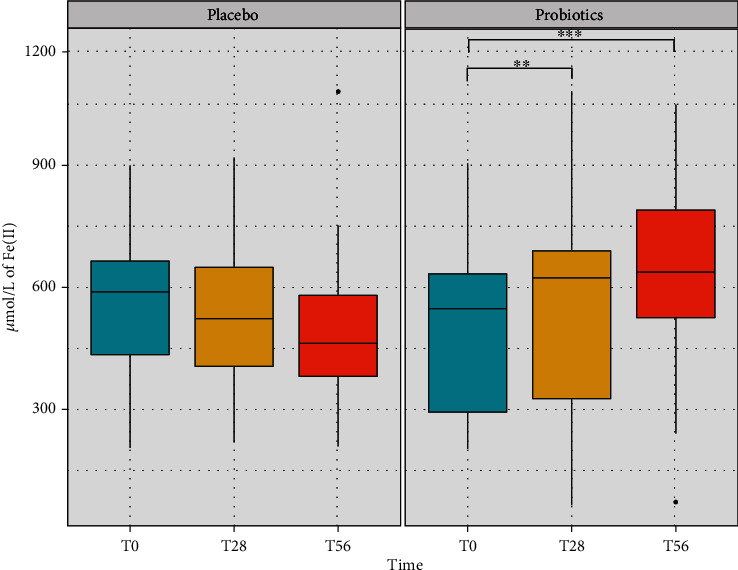
Figure 2.

Level of total antioxidant capacity (TAC) recorded in the saliva samples of volunteers in the placebo and in the probiotic groups at the three time points of the study (baseline, treatment, and follow-up). The activity was determined by the Ferric Reducing Ability of Plasma (FRAP) method and expressed as μmol/L of Fe (II) reduced. The boxplots show the minimum, the first quartile, the median, the third quartile, and the maximum of the FRAP values collected. Statistical differences were calculated using the Linear Mixed Effect Model (LMER): ∗∗p value < 0.01 and ∗∗∗p value < 0.001.
