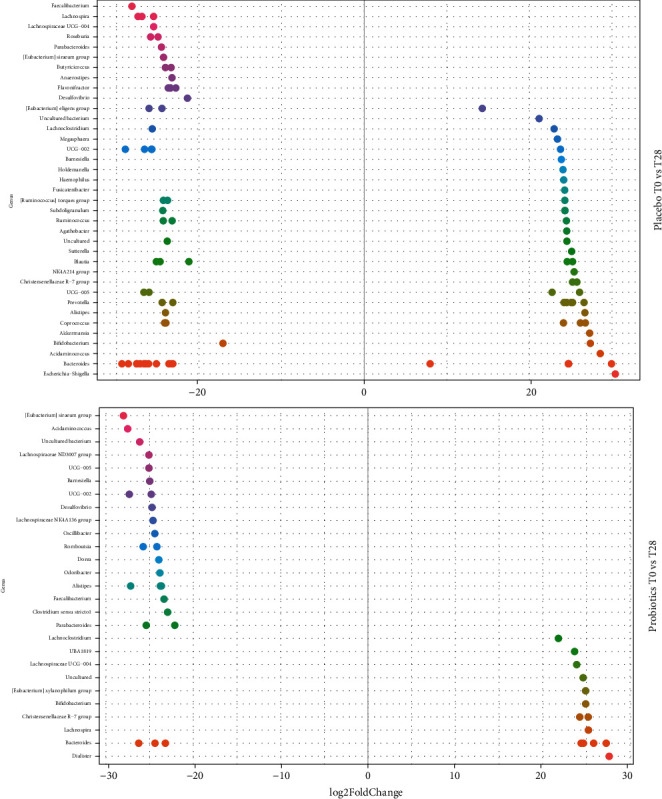
Figure 6.

Changes in relative abundances computed through DeSeq2 differential abundance analysis expressed as Log2FC comparison of the placebo and the probiotic group after the treatment (T28). Negative Log2FC represents genera enhanced in the placebo and in the probiotic group, while positive Log2FC represents genera enhanced only in one group. Each point represents an individual ASV assigned at the genus level. To enhance clarity, only those ASVs with p‐adj < 0.0001 are shown.
