Figure 1.

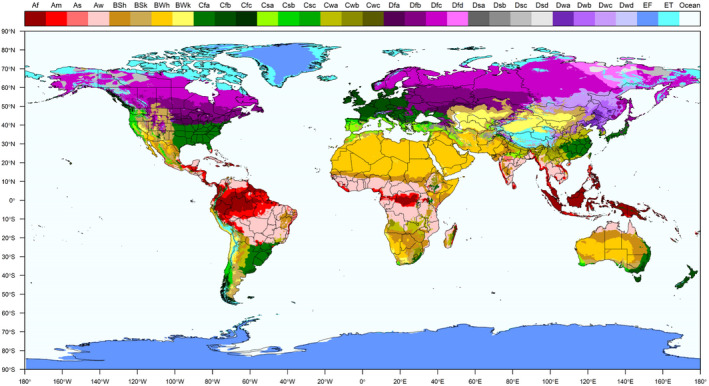
Köppen–Geiger climate classification. Different colours represent different climates. Climates are described in the top legend with a standard two or three letter code

Köppen–Geiger climate classification. Different colours represent different climates. Climates are described in the top legend with a standard two or three letter code