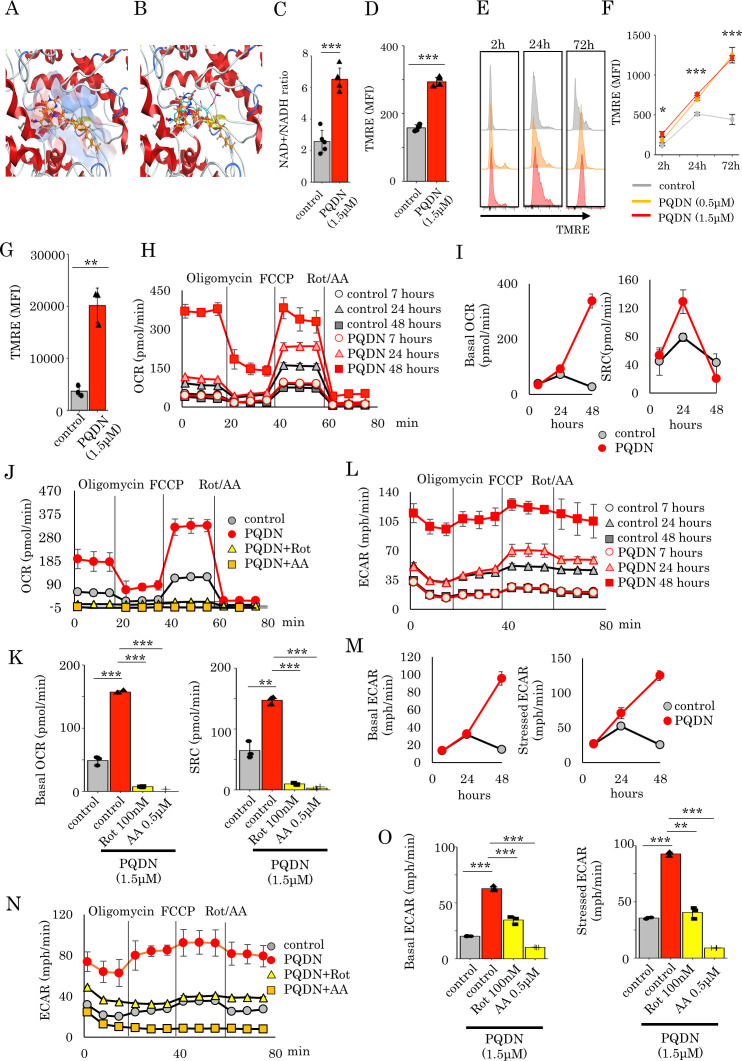
Figure 2.
(A) Docking model of PQDN to an NADH dehydrogenase FMN-binding site of mouse mitochondrial complex I using MOE. PQDN is indicated in orange in ball-stick representation. (B) Overlay of the original FMN and PQDN generated using MOE. FMN is indicated in cyan in line representation. (C) NADH activation induced by PQDN was measured using an NAD+/NADH assay kit (n=4 per group). (D) Flow cytometric analysis of the mean fluorescence intensity of TMRE in CD8 T cells treated with PQDN. (n=3 per group). (E, F) Kinetics of the TMRE dependent on stimulation time. (G) Flow cytometric analysis of the TMRE in CD8 TILs from CMS5a tumor-bearing mice (n=3 per group). (H and I) The oxygen consumption rate (OCR) of CD8 T cells treated with PQDN. The basal OCR or SRC are shown in figure 2I. (J and K) The OCR of CD8 T cells treated with PQDN for 24 hours using Rot or AA. The basal OCR or SRC are shown in figure 2K (n=3 per group). (L and M) The extracellular acidification rate (ECAR) of CD8 T cells treated with PQDN were measured. The basal and stressed ECAR are shown in figure 2M. (N and O) The ECAR of CD8 T cells treated with PQDN for 24 hours using Rot or AA. Basal and stressed ECAR are shown in figure 2O (n=3 per group). Data are presented as mean±SD. P values were determined using unpaired Student’s t-test or one-way analysis of variance with Tukey’s post-test. *P<0.05. The experiments were repeated at least two to three times. AA, antimycin A; FMN, flavin mononucleotide; Rot, rotenone; SRC, spare respiratory capacity; TMRE, tetramethylrhodamine methyl ester.

