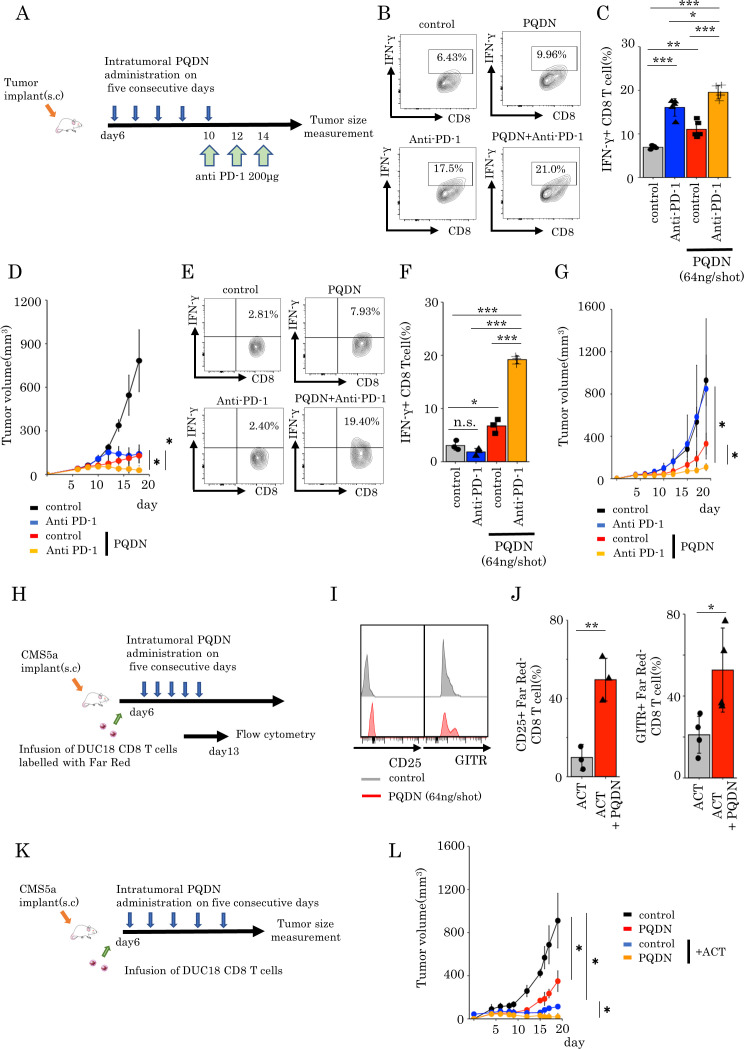
Figure 5.
(A–G) CT26 (A–D) or CMS5a (E–G) cells were subcutaneously inoculated into BALB/c mice. PQDN was injected intratumorally into the same mice on five consequent days (6–10). Anti-PD-1 antibody was administrated intravenously on days 10, 12, and 14 into the same mice. (B, C) Flow cytometric analysis of IFN-γ secretion in CD8 TILs from CT26 tumors treated with the combination of intratumoral PQDN and anti-PD-1 antibody. Data are shown as mean±SD (n=5 per group) and analyzed using one-way analysis of variance (ANOVA) with Tukey’s post-test. (D) CT26-bearing mice were treated with a combination of intra tumorous PQDN and anti-PD-1 antibody. Tumor sizes are shown (n=4–5 per group) and analyzed using two-way ANOVA with Tukey’s post-test. (E, F) Flow cytometric analysis of IFN-γ secretion in CD8 TILs from CMS5a tumors treated with the combination of intratumoral PQDN and anti-PD-1 antibody. Data are shown as mean±SD (n=3 per group) and analyzed using one-way ANOVA with Tukey’s post-test. (G) CMS5a-bearing mice were treated with a combination of intratumoral PQDN and anti-PD-1 antibody. Tumor sizes are shown (n=3–4 per group) and analyzed using two-way ANOVA with Tukey’s post-test. (H–L) CMS5a cells were subcutaneously inoculated into BALB/c mice. CD8 cells isolated from DUC18 mice were infused on day 6. PQDN was injected intratumorally into the same mice for five consequent days (days 6 to 10). (I, J) CD25, GITR expression in endogenous CD8 T cells (Far Red – T cells) from CMS5a tumors. Data are shown as mean±SD (n=3–4 per group) and analyzed using unpaired Student’s t-test. (L) Tumor sizes are shown (n=3 per group) and analyzed using two-way ANOVA with Tukey’s post-test. TILs, tumor-infiltrating lymphocytes.

