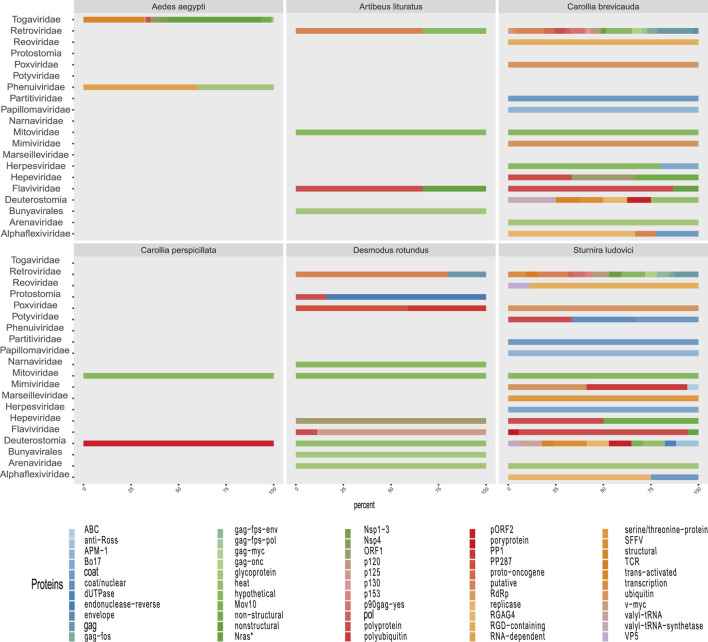
FIGURE 5.
Heatmaps of the proportions of sequencing reads classified into viral families by sample origin. Graphs (A and B) correspond to the highest proportion (families with >2% of total viral reads by sample) and the lowest proportion of reads (families with <2% of total viral reads by sample). The top columns represent annotations of the genome and host type of each identified family. Uncolored boxes correspond to unclassified families. Genome types are coded as dsDNA, dsRNA, ssDNA(+), ssRNA-RT, and ssRNA(+). Their hosts are coded here as A (Animalia), Ar (Archaea), B (Bacteria), C (Chromista), F (Fungi), and P (Plantae).

