FIGURE 8.

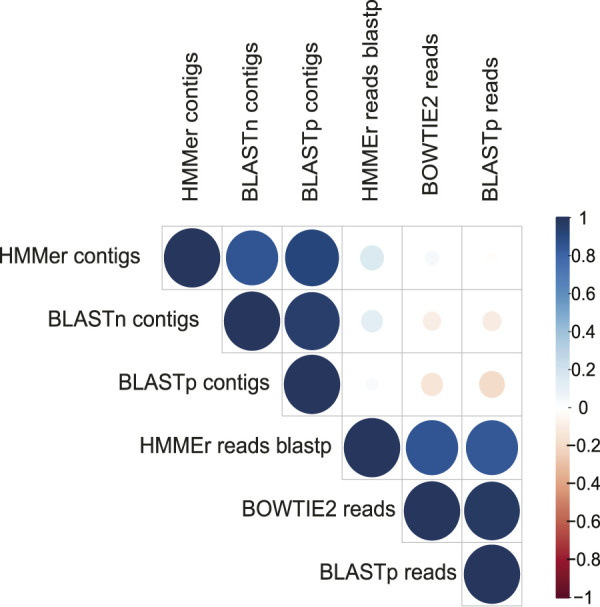
Proportion of contigs obtained related to viral proteins in each environmental metagenome. The colors allow to identify in the horizontal bars the rate of sequences related to viral proteins (x-axis) according to the viral family (y-axis) in each environmental model.
