
Extended Data Fig. 7 |. Activation, residency and dysfunction cell states in T cells.
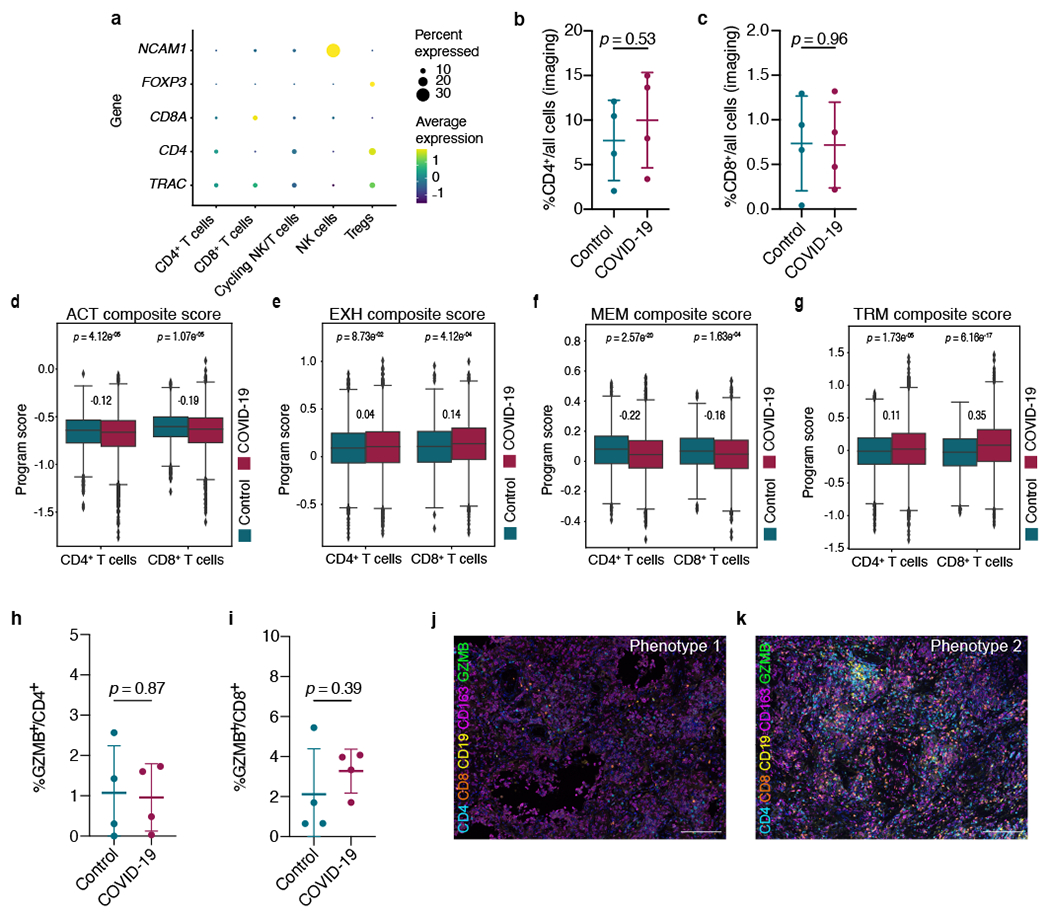
a, Expression of selected genes in cells of the T/NK cell compartment. Dot size indicates fraction of cells and colour indicates expression level. b, Quantification of cells with CD4+ staining as percentage of all cells (y-axis) in control and COVID-19 lungs (n = 4 donors per group). c, As in b, but for CD8+ T cells. Mean ± s.d., t-test. d–g, Expression of different program scores (tissue residency memory program, activation score, memory score and exhaustion score, all from K.S.P. Devi et al., see Methods) in CD4+ T cells (left) and CD8+ T cells (right) among control donors and individuals with COVID-19. Middle line, median; box edges, 25th and 75th percentiles; whiskers, most extreme points that do not exceed ±1.5 × IQR. Wilcoxon rank-sum test. Cohen’s D is indicated between the whiskers for each comparison (COVID-19 versus control). h, Quantification of CD4+GZMB+ T cells as percentage of CD4+ T cells (y-axis) in control and COVID-19 lungs (n = 4 donors per group). i, As in h, but for CD8+ T cells. Mean ± s.d., t-test. j, k, Representative multiplexed immunofluorescence of lung tissue from a patient with COVID-19 with a pure myeloid infiltrate (j) or with a mixed myeloid and lymphoid infiltrate (k; n = 4 donors per group). Scale bars, 200 μm.