
Extended Data Fig. 9 |. Cellular sources of inflammatory cytokines.
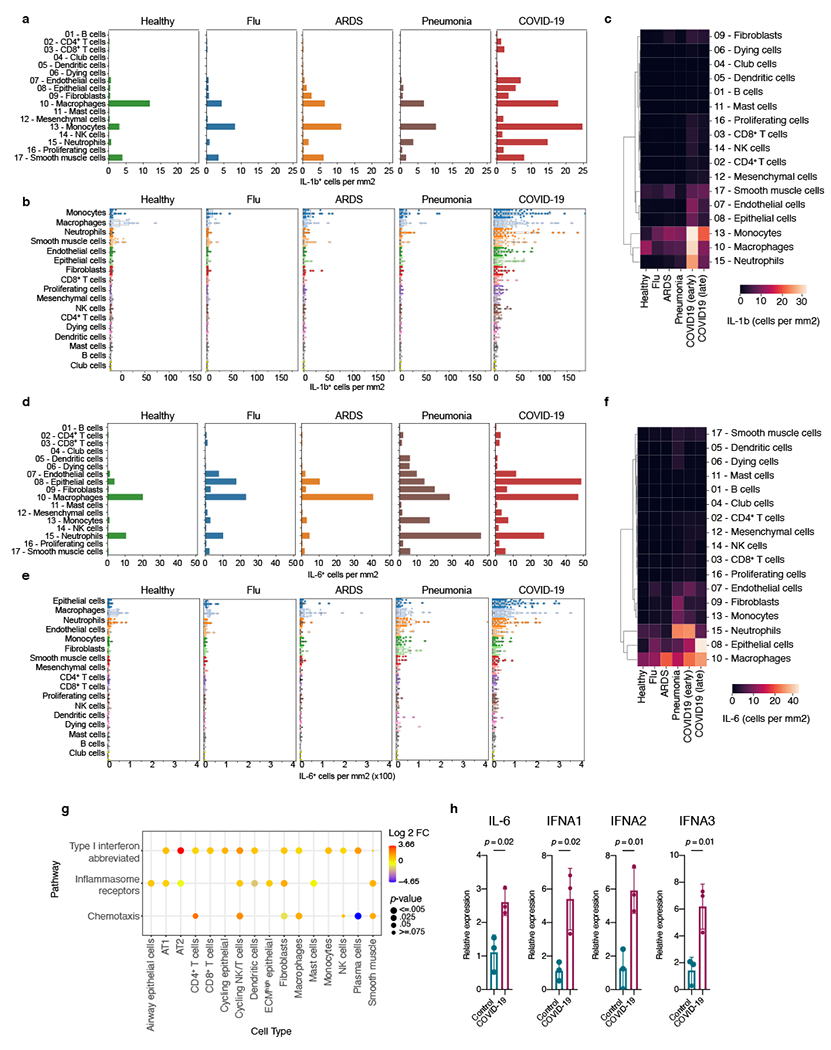
a, Average frequency of cell types expressing IL-1β across healthy and disease conditions. b, Quantification of IL-1β across cell types in healthy and disease conditions. Each dot represents a single region of interest (ROI). c, Quantification of IL-1β across healthy and disease conditions and cell types, including separation of patients with early death (within 14 days of onset of COVID-19 symptoms) and late death (within 30 days of onset of COVID-19 symptoms). d, Average frequency of cell types expressing IL-6 across healthy and disease conditions. e, Quantification of IL-6 across cell types in healthy and disease conditions. Each dot represents a single region of interest (ROI). f, Quantification of IL-6 across across healthy and disease conditions and cell types, including separation of patients with early death (within 14 days of onset of COVID-19 symptoms) and late death (within 30 days of onset of COVID-19 symptoms). g, Expression of selected manually curated gene sets of chemotaxis, inflammasome receptors and type I interferon (response) genes across different cell types (y-axis). Dot size indicates significance and colour indicates expression level (log2(fold-change)). h, qRT–PCR comparing IFNA1, IFNA2, IFNB1, and IL-6 mRNA levels in COVID-19 and control lungs (n = 3 donors for each group). Mean ± s.d., t-test.