
Fig. 4 |. Pathological fibroblasts and ensuing fibrosis in COVID-19.
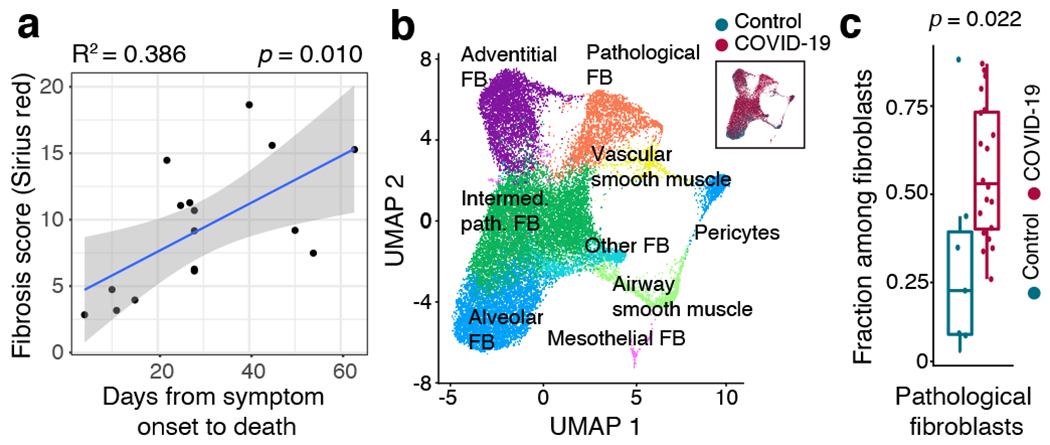
a, Coefficient of determination (R2) of days from symptom onset to death and fibrosis score in COVID-19 samples (n = 16, see Methods). Error bands, 95% s.e. interval on the Pearson correlation. b, UMAP of fibroblast (FB) sub-populations; insert indicates group assignments. path., pathological. c, Fractions of pathological fibroblasts among all fibroblasts in control (n = 7) and COVID-19 lungs (n = 19). Middle line, median; box edges, 25th and 75th percentiles; whiskers, most extreme points that do not exceed ±1.5 × IQR. Wilcoxon rank-sum test.