
Extended Data Fig. 4 |. Global changes in myeloid cells.
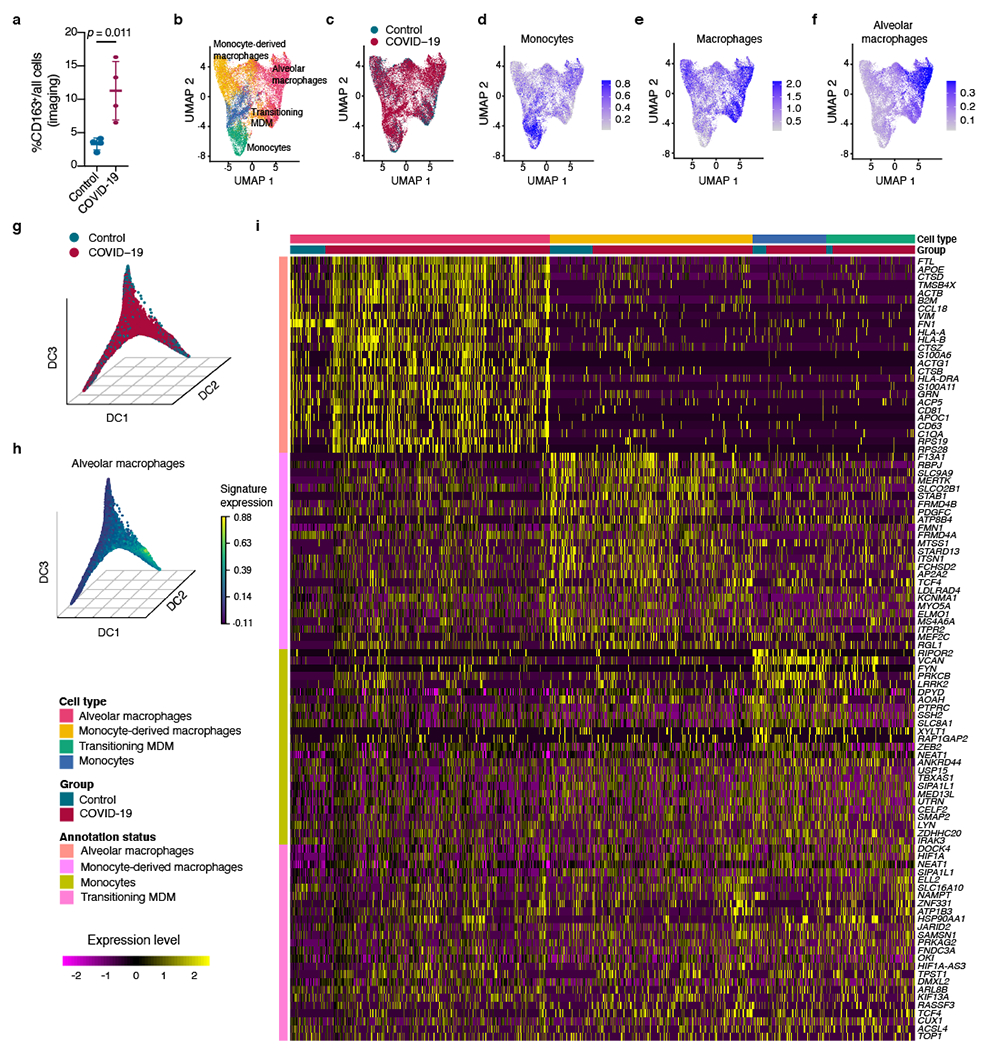
a, Quantification of cells with CD163+ staining as percentage of all cells in a subset of control and COVID-19 samples (n = 4 donors per group). Mean ± s.d., t-test. b, c, UMAP embedding with myeloid cell type assignment (b) and group assignment (c). d–f, Expression scores (log-normalized) for monocyte, macrophage and alveolar macrophage signatures in same UMAP embedding as b, c. g, First three DCs with annotation of control and COVID-19 lung samples. h, First three DCs with expression of the alveolar macrophage signature. i, Heatmap of top differentially regulated genes among indicated myeloid sub-populations. Left bar indicates genes that were differentially regulated in the respective cell types. Top lanes indicate cell type and group. Rows indicate log-normalized and scaled expression of genes (see Methods).