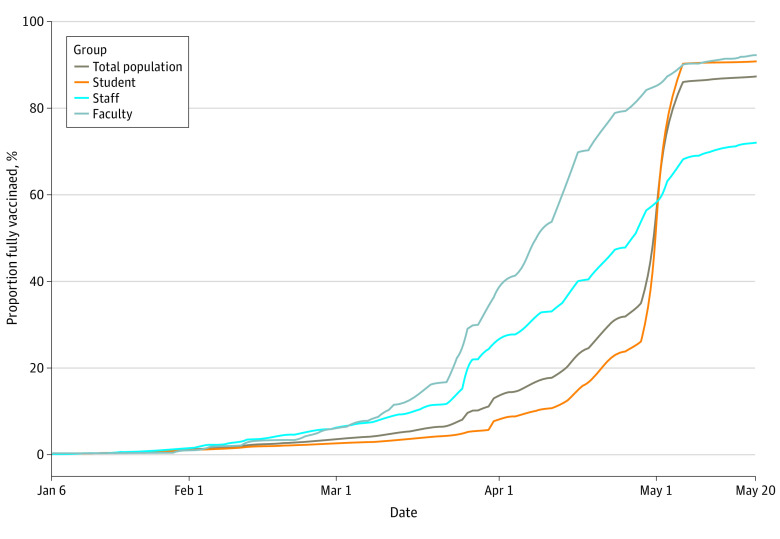
Figure 3. Daily Cumulative Percentage of Fully Vaccinated Individuals by Population Group.
The brown curve represents the daily cumulative percentage of fully vaccinated individuals of the total university Spring 2021 in-person population; the orange curve represents the rate of vaccination for the university Spring 2021 student population; the blue curve represents the rate of vaccination for the university Spring 2021 staff population; and the gray curve represents the rate of vaccination for the university Spring 2021 faculty population.

