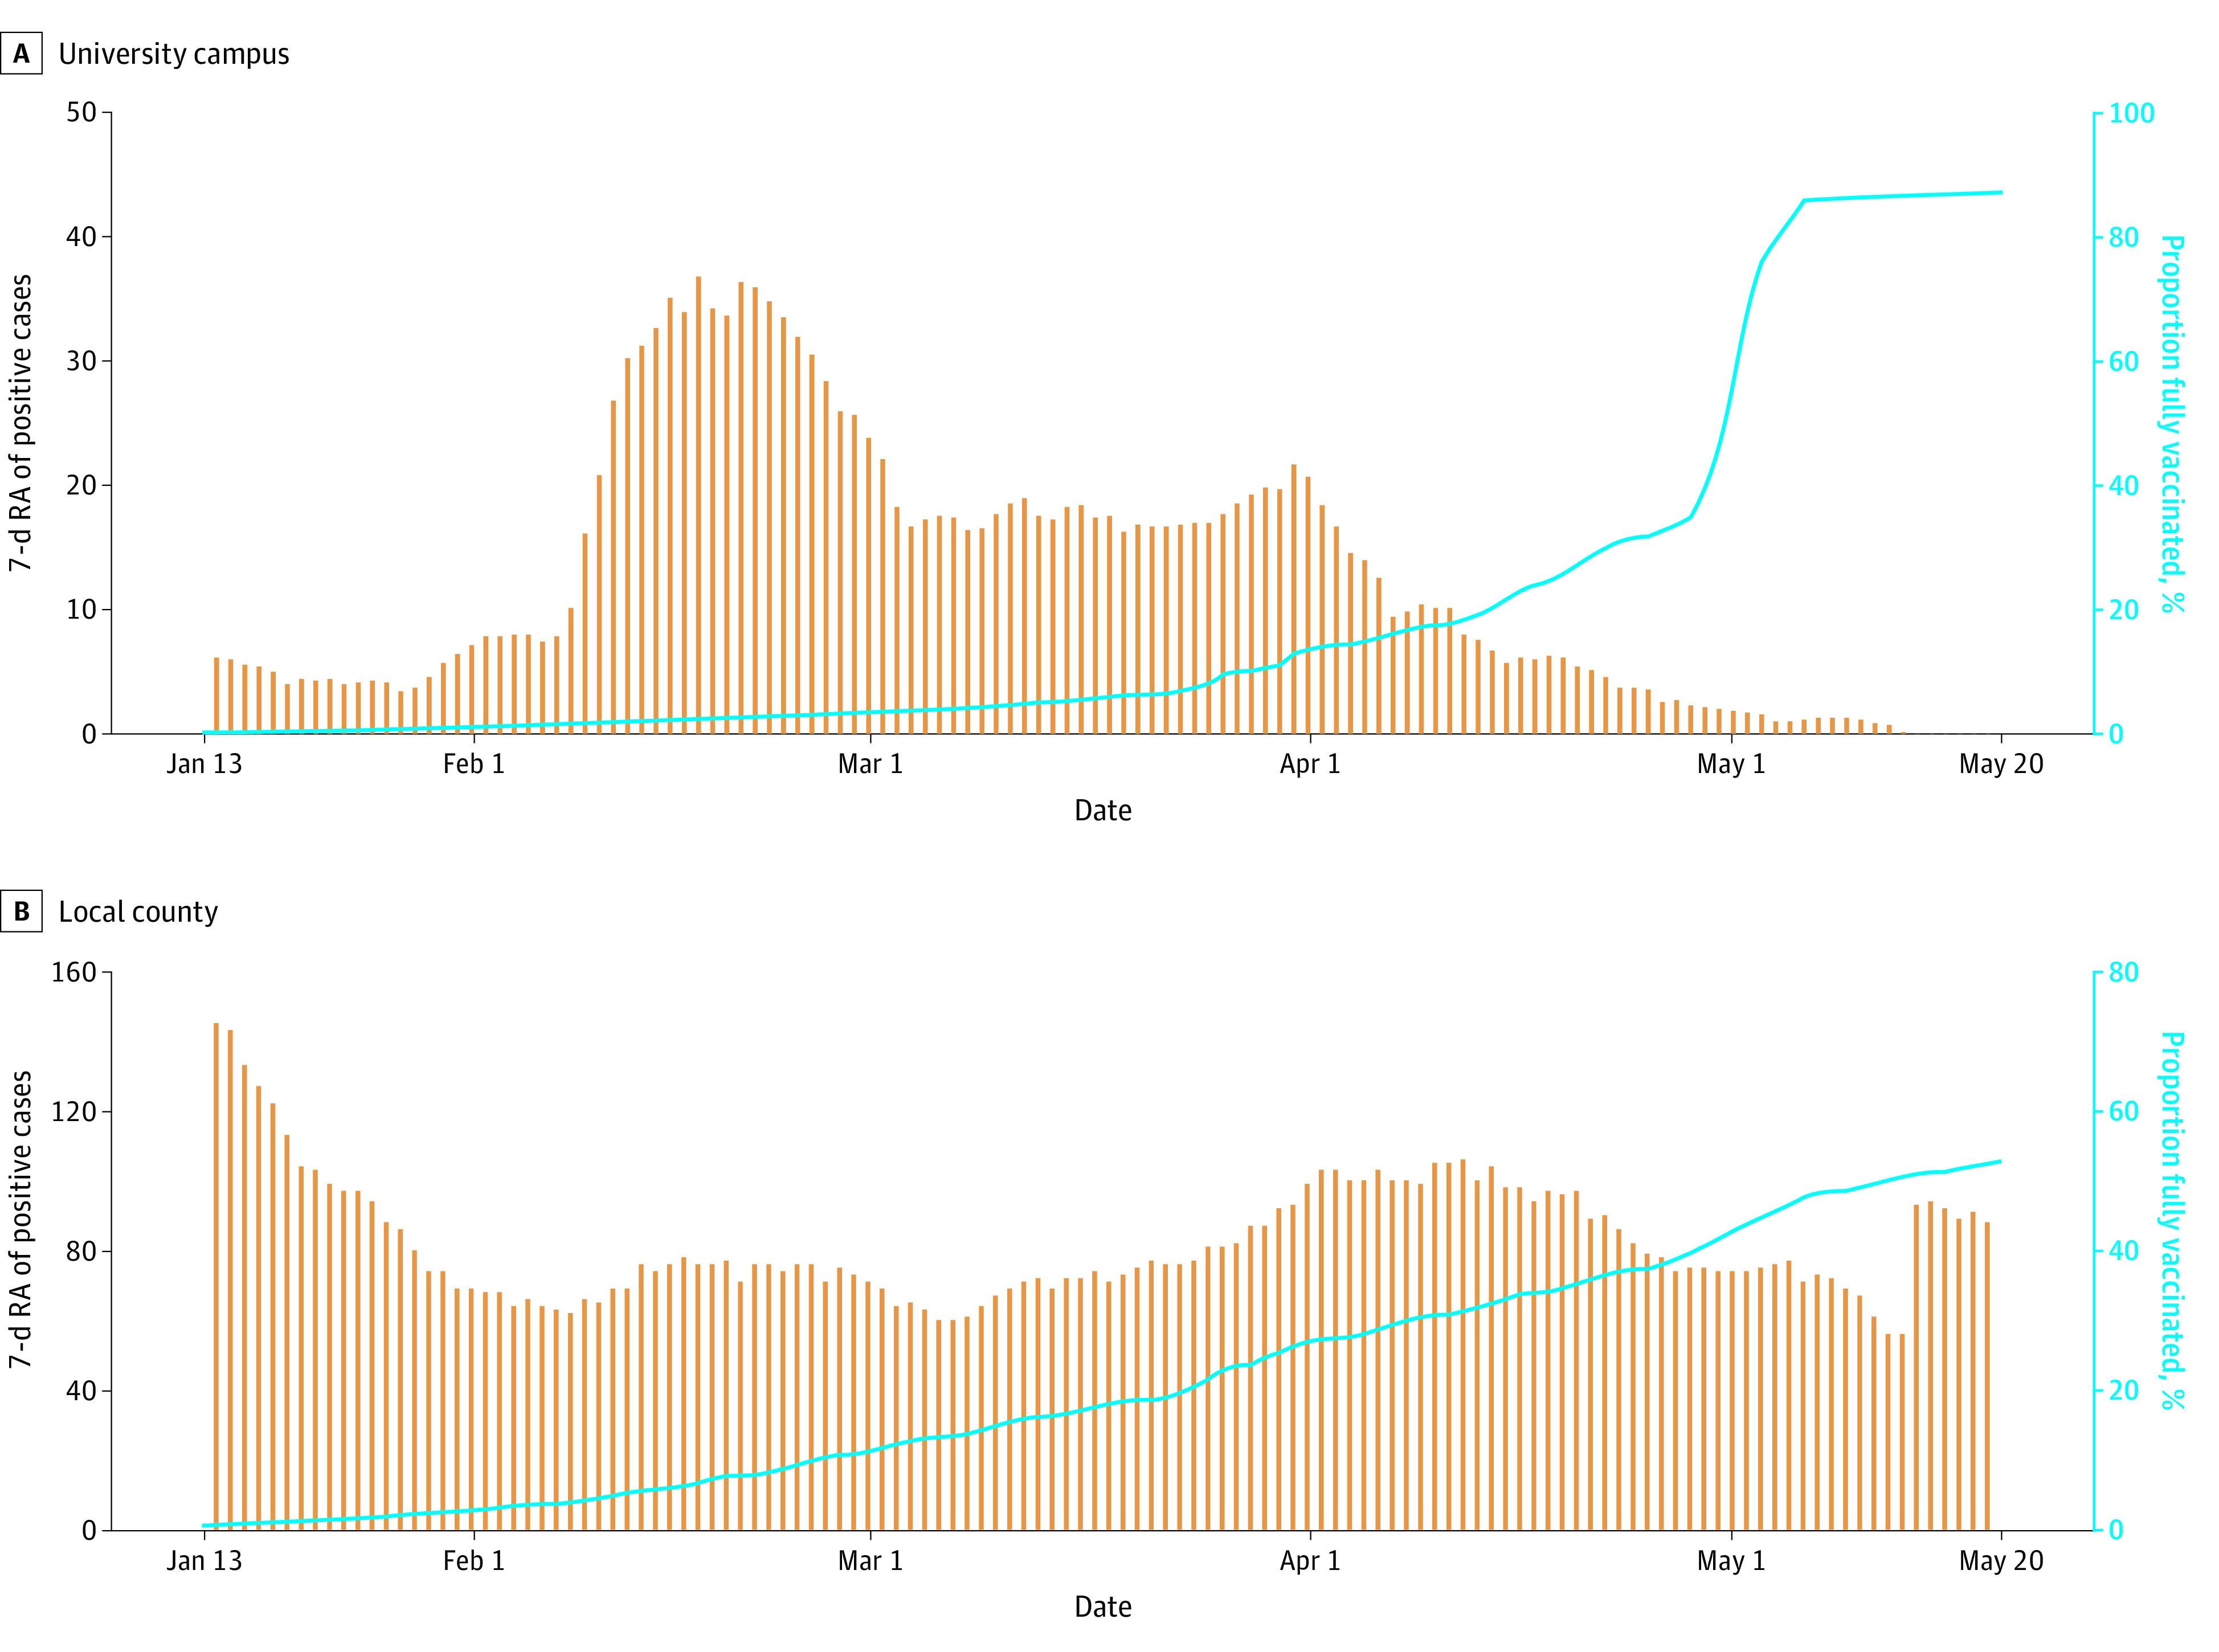
Figure 4. Longitudinal Trend of Positive Cases and Percent Vaccinated in the Population.

Comparison of (A) university campus and (B) local county 7-day rolling average of positive cases vs the percentage of fully vaccinated population.

Comparison of (A) university campus and (B) local county 7-day rolling average of positive cases vs the percentage of fully vaccinated population.