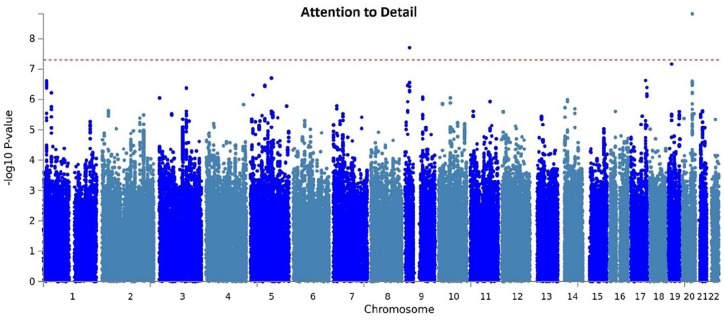
Figure 1.
Manhattan plot of the GWAS meta-analysis for ‘attention to detail’.
Each dot represents the result of the linear regression analysis for each single variant taking the attention to detail mean score as dependent variable and correcting for age, sex, gender and four MDS components. The x-axis shows the chromosomes and the y-axis shows the −log (two-sided) p-value of the association. The red dotted line indicates the threshold for genome-wide significance.

