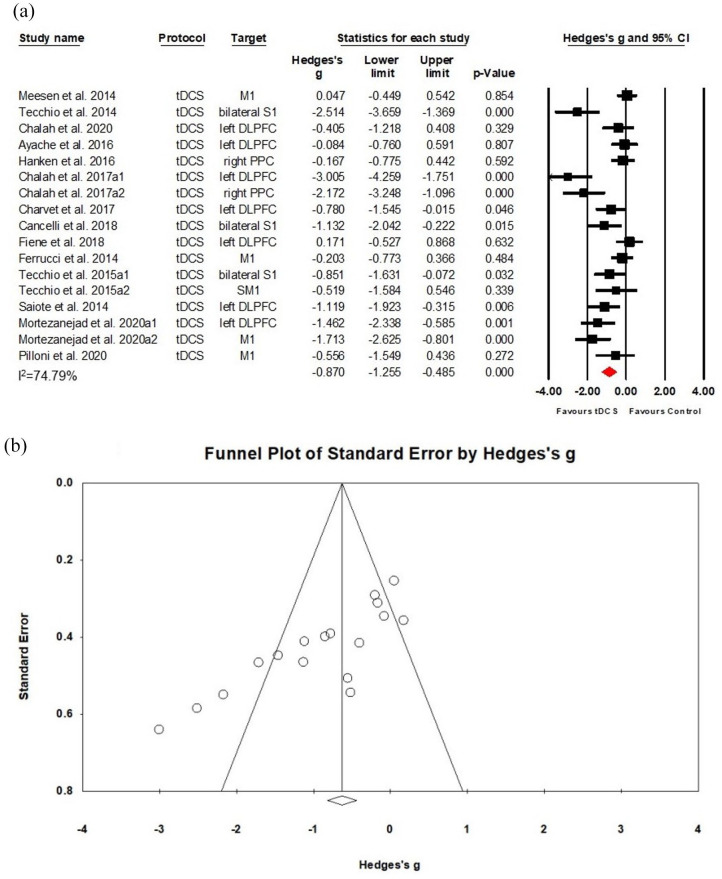
Figure 2.
Effects of tDCS on fatigue in MS: (a) a forest plot showing studies that compare anodal tDCS with sham stimulation for fatigue symptoms on MS. (b) Examination of bias. The figure depicts an asymmetric funnel plot (p < 0.001). Possible sources of asymmetry are publication bias, poor methodological quality, true heterogeneity, and chance.

