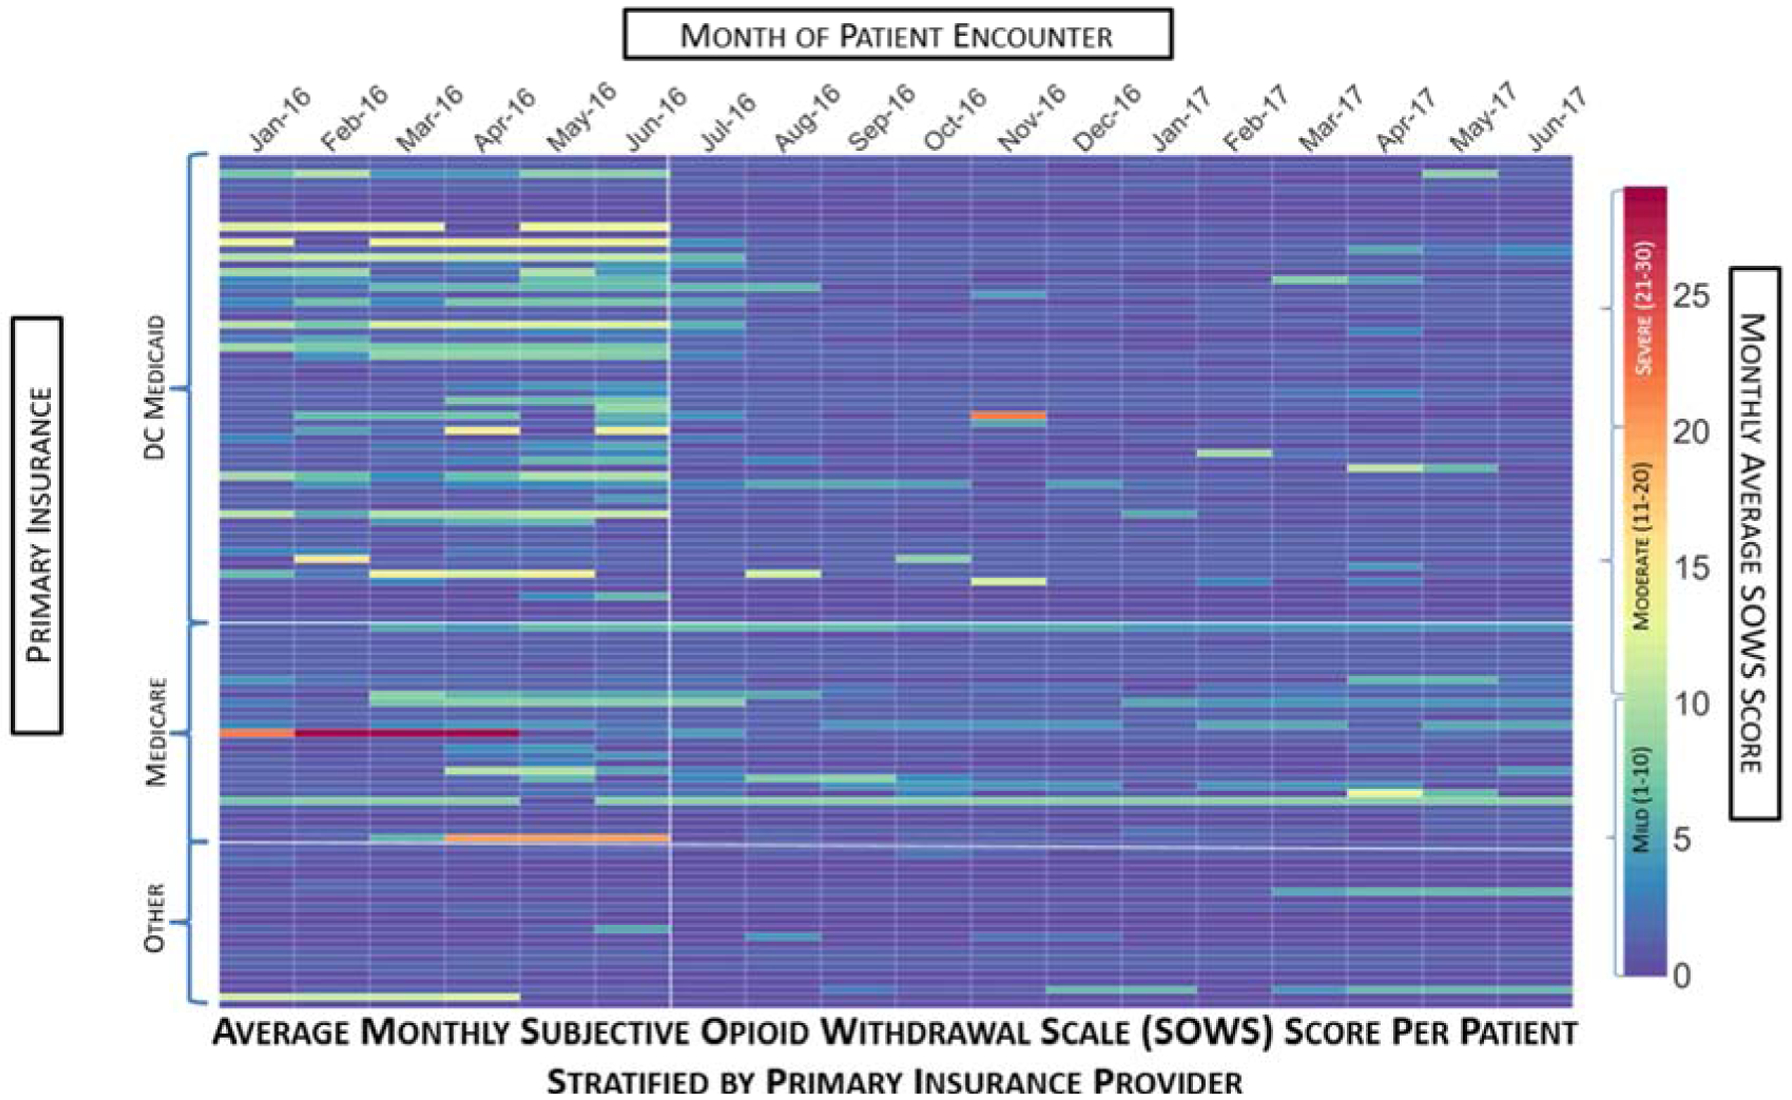
Figure 2:

Average Monthly Subjective Opioid Withdrawal Scale (SOWS) Score per Patient Stratified By Primary Insurance Provider. This heat map depicts the average monthly SOWS score per month over an 18-month span of patient encounters. Each column represents the month of patient encounter, each row depicts an individual patient, and the color of the rectangle depicts the monthly average SOWS score. The patient rows are stratified by the primary insurance provider type, with white lines separating the DC Medicaid, Medicare, and Other Insurance groupings. The color bar on the right indicates the relationship between the color of the rectangle and the SOWS score. The first six months (January 2016 – June 2016) comprise the SOC period in which patients were limited to a SBN maximum daily dose of 24 mg. The remaining 12 months (July 2016 – June 2017) comprise the PGx period in which patients could receive SBN doses exceeding 24 mg/day. The white vertical line after June 2016 demarcates the end of the SOC period. During this 18-month period, Medicare did not allow patients to receive SBN doses exceeding 24 mg/day. Therefore, during the PGx period, patients with Medicare as their primary insurance were unable to obtain SBN doses exceeding 24 mg/day and some of these patients exhibited slightly higher average monthly SOWS scores compared to the rest of the patients.
